Transcription of Infrared spectra of methanol, ethanol, and n-propanol
1 -- ~ ---------------------------~------------ ~--~------------------------------------ --~. Journal of Research of the National Bureau of StanJards Vol. 48, , April 1952 Research Paper 2314. Infrared spectra of Methanol, Ethanol, and n-propanol Earle K. Plyler The Infrared absorp tion spectra of m eth ano l, ethanol, a nd n-propanol have bee n meas- ured wi th prism instrum ents. Studies have bce n made of the vapors and of se veral dilu te solu tio ns. Th e m ethanol spectra , betwee n 2 to 15 mi cron s, provided a direct comparison w ith t he other two alcohols and co nfirm ed earli er wo rk on t h e cxistence of a numb er of low- intensity bands. The two other a lcohol s were studi ed from 2 to 36 mi crons. T he ?ands have been class ified in relation to the O - H , C - H , C - O, a nd C - C vibratIOn s wlthlll th e mo lecules. The long-wave absorption , in the region beyond 30 mi crons, for each alcohol, is att ribu ted to t he hindered rotation of OH.
2 Th e ob ject of t he present st ud y was to con- firm t he ass ig nm en ts for m ethanol and to stud y and assign th e vibrat ional spectra of ethanol and n-propan ol. 1. Introduction bromide iodid e h ave been described elsewhere [4). The standard P erkin Elmer therm ocouple was used The Infrared absorption spectrum of m ethanol in as a detec tor with all bu t the thallium bromide iodide th e vapor state was m easured by Bor den a nd Barker prism. H ere a Golay d etector was substituted for [l] l with a gratin g spectrometer. The s tro nger band s th e thermo couple. The spec trometers were equipped were resolved so t hat th e rotational structure was with a sli t control dev ice [5] , and except for th e Go . apparen t. Their observations showed which band lay cell, the experimental arrangemen ts were th e wei e of t he p erpendicular and which were of the ame as those describ ed in a previous p aper [5].]
3 Gas parallel typ e. Noether [2], using a pli~m instru- cells of differc n t thi ckn esses with vftriou s pressure ment , also m easured the spectrum of methanol and were used. TIlC experimental arrangement did not observed several weak bands in addition to tho se allow t he par tial pressures of the vapor to b e deter- studied b y Borden and Barker. Some of th ese weak mined as all th e cells could not b e evacuated . bands have been classified as fundamentals and com- Th e absorption spectrit of th e li quid s, with bination s [3]. Th e object of th e present study was to carbon tetrachloride and cftrbon disulfide, were m eas . confirm the assignments fo r methanol and to study ured on a Ba ird recording Infrared sp ec trometer a nd assign the vibrational pectra of ethanol and w it h a sodium chlorid e prism . Solutions of differe nt n-propanol . Th ese alcohols have no t been measured concentration s as well as cells of variolls thi cknesses previously over an extended infrar ed region , and their were used.
4 To obtain a hi gher resolution from spectra have not b een classified. to , measuremen ts in this region were r ep eated , In th e presen t work, t he spectra of ethanol a nd wit h a lithium-fluoride pri sm in th e Perkin-Elmer n propanol h ave b een measured from 2 to 40 in spec trome ter. the vapor state and from 2 to 15 in solutions of 0014 a nd OS2. Becau se of the simil a rity in struc 3. Results and Discussion ture of t h ese alcohols, the positions of many absorp . tion bands appear in th e same region s. No attemp t The experimental results are given in six figur es was m ade to repeat the lon g wavelength region in and two tables. F igure 1 presen ts the vapor ab- metha nol , as it would no t b e possible to improve on sorption spectra between 2 a nd 15 of methanol, the grating measurem ents of Borden and Barker ethanol, and n. propanol. In th e regions of strong wi t h a prism spectrograph.
5 However , th e 2- to water vapor absorption, ban ds in the alcohols could region was m easured as t his region had not not be measured with r easonabl e accuracy; hence, bee n recorded on a double-b eam instrument. dotted lines are used to denote the uncertainty of th e a bsorption in these regions. 2. Experimental Procedure As shown in figur e 1, methanol has a broad region of absorption centering near . This region The methanol, ethanol, and n pr opanol were puri- was restudied with the Perkin-Elmer model 21 spec- fied under the direction of F. D . Rossini. They trometer to take advantage of th e higher resolu tion were found to b e of high purity, which is essential made possible by the improved amplifier and to elimi- in order to attribu te weak bands to t he spectra of nate t he effect of th e water vapor bands. T h e re- the alcohols. suI ts are shown in figure 2. The absorption spectra of the vapors were deter- Figure 3 shows t he long wavelength spectra of min ed w ith P erkin-Elmer Infrared spectrometers, eth anol and n-propanol in th e vapor state.
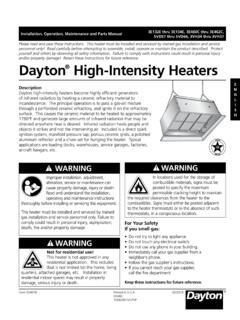
6 Ethanol models 12A a nd 120, usin g interchangeable prisms was examined in the region from 16 to 20 , using an of li thium fluoride , sodium chloride, potassium h o- absorption cellI m thick, bu t as th ere was no apppre- mide, and t hallium bromid e-iodide. This allowed ciable absorption th e curve is not shown. In the measurem ents to be m ade from 2 to approximately region from 20 to 38 jJ. li thium-fluoride, calcium- 38 . The properties and use of prisms of th allium fluorid e and sodium-fluoride re fl ectors w ere substi- I F igures in brackets indicate the li terature rererences at the end or tbis paper. tuted s~ccessively for th e usual aluminized mirror. 281. ~-- -- -- .. WAVE NU MBERS IN e M- I. SOOO 3000 2000 1500 1300 1100 1000 900 800 700. 100. 80. -------V--- ~. ',~ 5cm '. GO , 40. 20 METHANOL. VAPOR. -------'Vf~. Wr--\ ". 100. ,~.~ ~Otm '". w 80 .. I. , I. U. Z : I I. ' .. ~ I I.
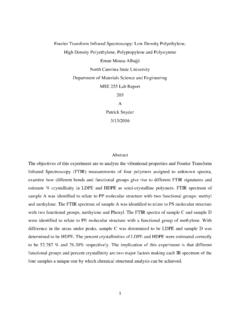
7 ;:; GO.. I, V. ". ICDcm <J> 40. z <t cr .. 20 ETHANOL. VAPOR. 10 0..-- - - - -------- -- ---\./'". 80. GO. 40. 20 n-PRO PANOl VAPOR. 0. 2. WAVELENGTH IN MICRONS. 13 14 . ~. FIGU R E l. I nfrared absorption spectra fl' om 2 to 15 of m ethanol, ethanol, and n-propanol in the vapor state_. rb,-t~~~sf~~~~ll~~:d ~~~ e~ac\~ ~~~~1101 ~por pressures at room tem perature except for the jn serts, wh!ch were obtained by removing so me of the \-a por from the .0 ME THYL ALCOHOL. (). VAPOR. 30. 20. 10. -v, -- ~. a~0~~--7. ~~--~'~O--~~7~.. --~--7..0~~--~ .~.--~--9~.O--~~. WA .. EL ENGTH IN MICRONS. FIGU R E 2_ I nfmred absorption spectrum from 6 to 10 !l oj methanol in the vapor state _ .. The pressure is sat urated ,-apor pressure at room temperature except lor the I' 16 11 II II 20 21 u. 1!3 t4 2' U 27 U )0 31 12 II 34 35 11 11 II. upper curve, which is at a pressure 01 6 em 01 H g. WAV[L[NGTH 1111 M'CRONS.]]
8 FIG U RE 3. InfmTed absoTption s pectra fTom 15 to 38 of Although this resulted in some loss in the total re- ethanol and n-pTopanol in the vapor state. fl ected energy, the stray radiation was reduced T he pressures are saturated vapor pressures lor the cun-e. of greatest absorption . consid erably. Table 1 lists the maxima observed in m ethanol, ethanol, and n -propanol, incorporating some of the tcrmine the band centers. 'W ith t he exception of the resul ts of the higher resolu tion work in the 6- to ,u region of methanol, which is more compli- lO- ,u region of m ethanol. The wavelength in mi- cated and whose individual maxima mav even b e crons, the wave numb er in cm- I , and the observed of a rotational nature, all the maxima of absorption intensity are given for each band. The inten sity arc listed . As a resul t, some of th e maxima in are divided into five categories, extending table 1 may be parts of bands, such a P , Q, 01' R.
9 From very weak to very strong. In the regions of branches, as well as separate hand s. This doubt considerable overlapping, it was not easy to de- as to the nature of the maxima in table 1 includes 282.. ow - .. TABLE] . Observed bands oj methanol, ethanol , and n-propanol i n the vapor state \V an' . lengt h \Vave numbcr I Inlens ii y II lVave- length 'Vave number I Inte ns ity 'Vave . length \\'ave number I I ntens ity I I II I. , M et hanol I' cm- l }Jo em-I I' cm- I. 4425 \I' 6. GI 1512 VW 1142 VIV. 40 16 \' \I' 1501 VIV S. SO 1136 VW. 1 :3687 M 1479 M 1114 VW. 3401 VI' 1455 M 2 04 1106 VW. 3017 M 1432 VW 1094 VW. ~989 i\I 7. 07 141 5 VIV 1056 VW. 3. 360 2976 M 7. 43 1346 S 1033 S. a 382 2959 M 1256 VW 946 VW. 3395 2946 S 1239 VW 820 VIV. 3. 414 2929 M 8. 17 1224 VW 12. 83 779 VW. 2847 S 1213 VIY 736 VW. 2667 V\I' 1171 vV\' 694 VW. 2057 \1' 11 64 VIV. Etha nol 2. 48. 4348. 4032. \1'. VI\, 290'1.
10 2890. S. M. 7, 19. 1391. 1242 I S. S. 3856 \ 1' 2513 VII' 1067 VS. 3687 M 4. 25 2353 W 11. 36 877 S. 3521 V\I' 2160 VIV SOl \1'. 3425 VII' 2110 W 427 M. 3. 08 3248 \\' 5. 20 1923 II' 2( 377 VW. 2994 S 5. 76 1736 M 353 VII'. 2977 S 1456 M a37 267 S. 2924 S. n,Propanol 4291 \1' 1393 S II. 13 898 M. 3687 M 1276 VII' 758 IV. 2978 S 1218 S 727 II'. 2946 f) 1066 VS 18. 0 555 VIV. 2929 S 1047 M 21. 6 463 M. 2892 M 1033 W 422 VIV. 4. 18 2392 VII' 1013 W 24 .6 407 VII'. 2053 VW 10. 31 971 S &35 286 S. 1464 J\I. [. Ce nter s of band beyond region of observatiollB. those in the region of J1. for all three alcohols and shows th e 2 . OH band resolved into P and R. t he region for n-propanol . branches. Figures 1 and 3 show tha t there are regions in The OH bands in ethanol and n-propanol which th e vapor-phase spectra of all three mole- were also measured. However, th e resol tion of the l cules are similar.]