Transcription of Infrared Spectroscopy
1 Chapter 15. Infrared Spectroscopy Sherman Hsu, Separation Sciences Research and Product Development Mallinckrodt, Inc. Mallinckrodt Baker Division Summary General Uses Identification of all types of organic and many types of inorganic compounds Determination of functional groups in organic materials Determination of the molecular composition of surfaces Identification of chromatographic effluents Quantitative determination of compounds in mixtures Nondestructive method Determination of molecular conformation (structural isomers) and stereochemistry (geometri- cal isomers). Determination of molecular orientation (polymers and solutions).
2 Common Applications Identification of compounds by matching spectrum of unknown compound with reference spectrum (fingerprinting). Identification of functional groups in unknown substances 247. 248 Handbook of Instrumental Techniques for Analytical Chemistry Identification of reaction components and kinetic studies of reactions Identification of molecular orientation in polymer films Detection of molecular impurities or additives present in amounts of 1% and in some cases as low as Identification of polymers, plastics, and resins Analysis of formulations such as insecticides and copolymers Samples State Almost any solid, liquid or gas sample can be analyzed.
3 Many sampling accessories are available. Amount Solids 50 to 200 mg is desirable, but 10 g ground with transparent matrix (such as KBr) is the mini- mum for qualitative determinations; 1 to 10 g minimum is required if solid is soluble in suitable sol- vent. Liquids L is needed if neat, less if pure. Gases 50 ppb is needed. Preparation Little or no preparation is required; may have to grind solid into KBr matrix or dissolve sample in a suitable solvent (CCl4 and CS2 are preferred). Many types of sample holders and cells are available. Water should be removed from sample if possible. Analysis Time Estimated time to obtain spectrum from a routine sample varies from 1 to 10 min depending on the type of instrument and the resolution required.
4 Most samples can be prepared for Infrared (IR) analysis in approximately 1 to 5 min. Limitations General Minimal elemental information is given for most samples. Background solvent or solid matrix must be relatively transparent in the spectral region of in- terest. Molecule must be active in the IR region. (When exposed to IR radiation, a minimum of one vi- brational motion must alter the net dipole moment of the molecule in order for absorption to be observed.). Infrared Spectroscopy 249. Accuracy In analysis of mixtures under favorable conditions, accuracy is greater than 1%. In routine analyses, it is 5%. Sensitivity and Detection Limits Routine is 2%; under most favorable conditions and special techniques, it is Complementary or Related Techniques Nuclear magnetic resonance provides additional information on detailed molecular structure Mass spectrometry provides molecular mass information and additional structural information Raman Spectroscopy provides complementary information on molecular vibration.
5 (Some vi- brational modes of motion are IR-inactive but Raman-active and vice versa.) It also facilitates analysis of aqueous samples. Cell window material may be regular glass. Introduction Infrared (IR) Spectroscopy is one of the most common spectroscopic techniques used by organic and inorganic chemists. Simply, it is the absorption measurement of different IR frequencies by a sample positioned in the path of an IR beam. The main goal of IR spectroscopic analysis is to determine the chemical functional groups in the sample. Different functional groups absorb characteristic frequencies of IR radiation. Using various sampling accessories, IR spectrometers can accept a wide range of sam- ple types such as gases, liquids, and solids.
6 Thus, IR Spectroscopy is an important and popular tool for structural elucidation and compound identification. IR Frequency Range and Spectrum Presentation Infrared radiation spans a section of the electromagnetic spectrum having wavenumbers from roughly 13,000 to 10 cm 1, or wavelengths from to 1000 m. It is bound by the red end of the visible region at high frequencies and the microwave region at low frequencies. IR absorption positions are generally presented as either wavenumbers ( ) or wavelengths ( ). Wavenumber defines the number of waves per unit length. Thus, wavenumbers are directly proportion- al to frequency, as well as the energy of the IR absorption.
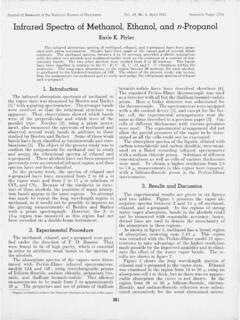
7 The wavenumber unit (cm 1, reciprocal cen- timeter) is more commonly used in modern IR instruments that are linear in the cm 1 scale. In the contrast, wavelengths are inversely proportional to frequencies and their associated energy. At present, the recommended unit of wavelength is m (micrometers), but (micron) is used in some older litera- ture. Wavenumbers and wavelengths can be interconverted using the following equation: 1 1 4 ( ). ( in cm ) = ------------------------ 10. ( in m ). IR absorption information is generally presented in the form of a spectrum with wavelength or wavenumber as the x-axis and absorption intensity or percent transmittance as the y-axis (Fig.)
8 250 Handbook of Instrumental Techniques for Analytical Chemistry Transmittance, T, is the ratio of radiant power transmitted by the sample (I) to the radiant power inci- dent on the sample (I0). Absorbance (A) is the logarithm to the base 10 of the reciprocal of the transmit- tance (T). A = log 10 ( 1 T ) = log 10 T = log 10 I I 0 ( ). The transmittance spectra provide better contrast between intensities of strong and weak bands be- cause transmittance ranges from 0 to 100% T whereas absorbance ranges from infinity to zero. The an- alyst should be aware that the same sample will give quite different profiles for the IR spectrum, which is linear in wavenumber, and the IR plot, which is linear in wavelength.
9 It will appear as if some IR. bands have been contracted or expanded. The IR region is commonly divided into three smaller areas: near IR, mid IR, and far IR. Near IR Mid IR Far IR. Figure IR spectra of polystyrene film with different x-axis units. (a) Linear in wavenumber (cm 1), (b) linear in wavelength ( m).(Reprinted from R. M. Silverstein, G. C. Bassler, and T. C. Morrill, Spectrometric Identifica- tion of Organic Compounds, 4th edition. New York: John Wiley & Sons, 1981, p. 166, by permission of John Wiley & Sons, Inc., copyright 1981.). Infrared Spectroscopy 251. Wavenumber 13,000 4,000 cm 1 4,000 200 cm 1 200 10 cm 1.
10 Wavelength m 50 m 50 1,000 m This chapter focuses on the most frequently used mid IR region, between 4000 and 400 cm 1 ( to 25 m). The far IR requires the use of specialized optical materials and sources. It is used for analysis of organic, inorganic, and organometallic compounds involving heavy atoms (mass number over 19). It provides useful information to structural studies such as conformation and lattice dynamics of sam- ples. Near IR Spectroscopy needs minimal or no sample preparation. It offers high-speed quantitative analysis without consumption or destruction of the sample. Its instruments can often be combined with UV-visible spectrometer and coupled with fiberoptic devices for remote analysis.