Transcription of Frequency Response with MATLAB Examples
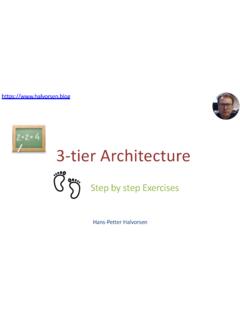
1 Frequency Response with MATLAB Examples control design and analysis Hans-Petter Halvorsen Contents Introduction to PID control Introduction to Frequency Response Frequency Response using Bode Diagram Introduction to Complex Numbers (which Frequency Response Theory is based on). Frequency Response from Transfer Functions Frequency Response from Input/output Signals PID Controller design and Tuning (Theory). PID Controller design and Tuning using MATLAB . Stability analysis using MATLAB . Stability analysis of Feedback Systems Stability analysis of Feedback Systems a Practical Example The Bandwidth of the control system Practical PI Controller Example PID control Hans-Petter Halvorsen control system .
2 Controller Actuators Process . Filtering Sensors Reference Value, SP (Set-point), SV (Set Value). Measurement Value (MV), Process Value (PV). Error between the reference value and the measurement value ( = ). Disturbance, makes it more complicated to control the process - control Signal from the Controller The PID Algorithm . = + + . 0. Where is the controller output and is the Tuning Parameters: control error: = ( ) Proportional Gain is the Reference Signal or Set-point Integral Time [sec. ]. is the Process value, , the Measured value Derivative Time [sec. ]. The PI Algorithm . = + . 0. Where is the controller output and is the Tuning Parameters: control error: = ( ) Proportional Gain is the Reference Signal or Set-point Integral Time [sec.]
3 ]. is the Process value, , the Measured value PI(D) Algorithm in MATLAB . We can use the pid() function in MATLAB . We can define the PI(D) transfer function using the tf() function in MATLAB . We can also define and implement a discrete PI(D) algorithm Discrete PI Controller Algorithm We start with: . = 0 + + . 0. In order to make a discrete version using, , Euler, we can derive both sides of the equation: . = 0 + + .. If we use Euler Forward we get: 1 0, 0, 1 1 . = + + .. Then we get: . = 1 + 0, 0, 1 + 1 + .. Where = . We can also split the equation above in 2 different parts by setting: = 1. This gives the following PI control algorithm: = .. = 0, 0, 1 + 1 + .. = 1 +.
4 This algorithm can easily be implemented in MATLAB . Discrete PI Controller Algorithm Discrete PI control algorithm: = .. = 0, 0, 1 + 1 + .. = 1 + . PID Controller Transfer Function We have: . = + + . 0. Laplace gives: ( ) . = = + + . ( ) . or: ( ) ( 2 + + 1). = =. ( ) . PI Controller Transfer Function We have: . = + . 0. Laplace gives: ( ) + ( + 1). = = + = =. ( ) . Finally: ( ) ( + 1). = =. ( ) . Define PI Transfer function in MATLAB . clear, clc % PI Controller Transfer function Kp = ;. ( ) ( + 1) Ti = 18;. = =. ( ) num = Kp*[Ti, 1];. den = [Ti, 0];. Hpi = tf(num,den).. PI Controller State space model Given: . = + .. 1. We set = = = .. This gives: = .. = + .. Where =.
5 PI Controller Discrete State space model Using Euler: +1 .. Where is the Sampling Time. This gives: +1 . = .. = + .. Finally: = .. = + .. +1 = + . PI Controller Discrete State space model implemented in MATLAB clear, clc .. for i=1:N.. e = r - y;. u = Kp*e + z;. z = z + dt*Kp*e/Ti;.. end plot(..). Frequency Response Hans-Petter Halvorsen Theory Frequency Response The Frequency Response of a system is a Frequency dependent function which expresses how a sinusoidal signal of a given Frequency on the system input is transferred through the system . Each Frequency component is a sinusoidal signal having certain amplitude and a certain Frequency . The Frequency Response is an important tool for analysis and design of signal filters and for analysis and design of control systems.
6 The Frequency Response can be found experimentally or from a transfer function model. The Frequency Response of a system is defined as the steady-state Response of the system to a sinusoidal input signal. When the system is in steady-state, it differs from the input signal only in amplitude/gain (A) and phase lag ( ). Theory Input Signal Frequency Response Output Signal Input Signal Dynamic Output Signal = system = . ( + ).. Amplitude Frequency Gain Phase Lag The Frequency Response of a system expresses how a sinusoidal signal of a given Frequency on the system input is transferred through the system . The only difference is the gain and the phase lag. Frequency Response - Definition Theory = =.
7 ( + ).. Input Dynamic Output system = 1 / . = 1 / . and the same for Frequency 2, 3, 4, 5, 6, etc. The Frequency Response of a system is defined as the steady-state Response of the system to a sinusoidal input signal. When the system is in steady-state, it differs from the input signal only in amplitude/gain (A) (Norwegian: forsterkning ) and phase lag ( ) (Norwegian: faseforskyvning ). Frequency Response - Simple Example Theory Outside Temperature T = 1 year Frequency 1 (year). Dynamic system Frequency 1 (year). Inside Temperature Note! Only the gain and phase are different Assume the outdoor temperature is varying like a sine function during a year ( Frequency 1) or during 24 hours ( Frequency 2).
8 Then the indoor temperature will be a sine as well, but with different gain. In addition it will have a phase lag. Frequency Response - Simple Example Theory Outside Temperature T = 24 hours Frequency 2 (24 hours). Dynamic system Frequency 2 (24 hours). Inside Temperature Note! Only the gain and phase are different Assume the outdoor temperature is varying like a sine function during a year ( Frequency 1) or during 24 hours ( Frequency 2). Then the indoor temperature will be a sine as well, but with different gain. In addition it will have a phase lag. Frequency Response using Bode Diagram Hans-Petter Halvorsen Bode Diagram You can find the Bode diagram from experiments on the physical process or from the transfer function (the model of the system ).
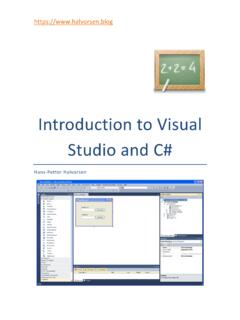
9 A simple sketch of the Bode diagram for a given system : The Bode diagram gives a simple Graphical overview of the Frequency Response for a . 0 [rad/s] given system . A Tool for Analyzing the . Stability properties of the control system . With MATLAB you can easily create Bode diagram from the Transfer function model using the bode() function 180. [rad/s]. Bode Diagram from experiments Find Data for different frequencies We find and for each of the frequencies, : .. Based on that we can plot the Frequency Response in a so-called Bode Diagram: Bode Diagram The x-scale is logarithmic Gain ( Forsterkningen ). Note! The y-scale is in [ ]. = 20 10 . Phase lag ( Faseforkyvningen ).
10 The y-scale is in [ ]. 2 = 360 . Normally, the unit for Frequency is Hertz [Hz], but in Frequency Response and Bode = 2 . diagrams we use radians [rad/s]. The relationship between these are as follows: Frequency Response MATLAB . Transfer Function: MATLAB Code: clear clc close all % Define Transfer function num=[1];. den=[1, 1];. H = tf(num, den). % Frequency Response bode(H); The Frequency Response is an important tool for analysis and design grid on of signal filters and for analysis and design of control systems. Frequency Response MATLAB . Transfer Function: clear clc close all % Define Transfer function num = [1];. Instead of Plotting the Bode Diagram we den = [1, 1].