Transcription of Gender Pay Gap Report - admin.ox.ac.uk
1 1We are pleased to publish our data on Gender equality. It is one important way of maintaining momentum and ensuring lack of women occupying senior roles in universities remains a challenge to the Higher Education sector. Oxford, while an exceptional institution, is no exception when it comes to Gender equality. We continue to work, however, with enthusiasm, energy and determination to address the considerable number of our initiatives are beginning to have an impact but there is some way to go. To ensure progress we have committed to: achieve a yearly increase in the proportion of female Professors, with 30% representation by 2020; achieve one third representation of women across University leadership roles including but not limited to heads of department and senior management teams; achieve a minimum of 30% of female members of Council and each of its main committees (Education, Personnel, Research, Planning and Resource Allocation, and General Purposes).
2 A 30% target is generally recognised as an effective tipping point towards full equality. Since the commitments were adopted, female representation on the Council of the University has risen to 41%. The appointment rate for female statutory professors has risen from 15% in 2010-12 to 35% have been asked on countless occasions for comments on my role as Oxford s first female Vice-Chancellor. I have usually responded by expressing the wish that we fix things so that our daughters will not have to be the first female anything. I hope we welcome this Report and hope you will find it useful. Louise Richardson Vice-Chancellor University of OxfordGender Pay Gap ReportIntroduction Key points At the University of Oxford s median Gender pay gap is lower than the median pay gap for the whole economy as reported by the Office for National Statistics.
3 The mean Gender pay gap of is higher than the national average. The mean bonus pay gap is 79% and median bonus pay gap is A greater proportion of women are in receipt of bonus payments than men. march 2018 Gender Pay Gap Report 20182background 1 Visit for more information on equality and diversity at the University of Oxford is committed to fostering an inclusive culture which promotes equality, values diversity and maintains a working, learning and social environment in which the rights and dignity of all its staff and students are Gender equality is a key strategic priority for the University of Oxford.
4 Demonstrated in both our Strategic Plan 2013-18 and our commitment to Athena an employer with more than 250 employees it is a legal requirement for the University to Report its Gender pay gap based on the snapshot date of 31 March 2017 and to publish the pay information by 30 March accordance with the regulations and with reference to the Equality Act 2010 the University s Gender pay gap Report includes data relating to persons who are engaged by the legal entity incorporated under the name The Chancellors Masters and Scholars of the University of Oxford ( the University ). This includes employees in University of Oxford departments, casual workers (including those undertaking casual teaching), those engaged through the University s Temporary Staffing Service and those who work within Oxford University Press ( OUP ).
5 The University reporting does not include colleges or subsidiary companies, which are separate legal entities. OUP has provided its UK data to the University s Personnel Committee in an anonymised format. OUP has not historically been included in reporting undertaken by the rest of the University and takes decisions on its own pay and grading employees are employed on either clinical or non-clinical grades. The majority of non-clinical staff are employed on one of the eleven grades on the University s main salary and grading structure. Senior staff are employed on grades relating to job type, for example, the Statutory Professor grade, senior research grade, or managerial and professional grade.
6 For staff on clinical grades, grade and pay is determined by an individual s stage in training and mirrors what the individual would receive in the NHS. Salaries for clinical academics with consultant contracts are determined by recognised seniority and experience within the data provided in this Report is based on the snapshot date of 31 March 2017. The initial pay period for employees is therefore the March payroll plus the previous 12 working weeks for those with irregular hours in addition to the previous 12 months of data relating to bonus pay. The data excludes those individuals on reduced pay for example through sickness, maternity, paternity, or other unpaid data was extracted as close as possible to 31 March 2017 in order to minimise the impact of subsequent changes to appointment records and a data assurance exercise has been undertaken, including detailed checking of a random 1% sample of the Pay Gap Report 20183 Findings3 Definitions: Mean is the sum divided by the count.
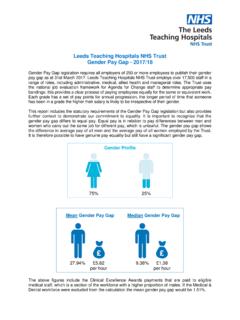
7 Median is the middle valueOn the 31 March 2017 the University s workforce for the purpose of Gender pay gap reporting consisted of 17,363 individuals; 9,238 women and 8,125 men. The University s Gender pay gaps are as follows:3 Gender pay gaps in ordinary payFemale earnings Mean Gender pay gap in ordinary hourly lowerMedian Gender pay gap in ordinary hourly lower Gender pay gaps in bonus payFemale earnings Mean Gender pay gap in bonus pay lowerMedian Gender pay gap in bonus pay lowerProportion in receipt of bonus payFemale earnings of males and females in each pay quartile100% Middle Middle QuartileUpper Male Percent of males and females in each pay quartile100% Middle Middle QuartileUpper Male Gender Pay Gap Report 20184 Narrative4 Data as at 31 July 2016 when the University completed its most
8 Recent equal pay audits5 Data as at 31 July 2016 when the University completed its most recent equal pay audits6 See for the University and departmental Athena SWAN mean hourly rate is calculated by adding all of the hourly rates together and dividing by the number of individuals in the data median hourly rate is calculated by arranging the hourly rates of all individuals in the data set in numerical order to identify the middle (or median) hourly rate. 50% of individuals will earn more than this hourly rate and 50% will earn pay gaps are calculated as the difference in the mean and median hourly rates for men and figures show that the University has a mean Gender pay gap of and a median Gender pay gap of pay is often considered to be a better measure of pay gaps as it is not affected by outliers or extreme values in the way that the mean is.
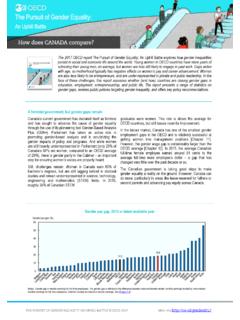
9 The median Gender pay gap for the whole economy (according to the October 2017 ONS ASHE figures) is Pay quartilesThe Gender pay gaps identified are mainly attributable to a lack of women in senior roles in the University. There is a greater proportion of men than women in the upper pay quartile and a greater proportion of women than men in the lower and lower middle pay quartiles. This is owing to an uneven distribution of men and women across grades, with women generally accounting for a higher percentage of the staff in grades at the lower end of the structure and men accounting for a higher percentage of staff in senior grades.
10 A slightly greater proportion of women than men are employed in the upper middle pay at the distribution of University employees across its grading structures helps explain the difference in the mean and median Gender pay gaps identified. The majority of University employees are employed on its main salary and grading structure (92%4) and the median salaries for both men and women fall within this range. The median pay gap is less influenced by the value of salaries at senior level than the mean pay gap. 76%5 of staff on senior grades are men and 82% of those listed as earning over 100K in the University s financial statements for 2016-2017 were men.