Transcription of GIRLS UK
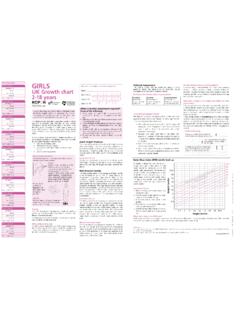
1 5049484746454443424140393837363534333231 3029282726252423222120191817161514131211 1098 BMIP lease place sticker (if available) otherwise write in space :_____NHS/CHI No:Hospital No:Date of Birth: GIRLS UKBody mass index (BMI)2-20 yearsThe BMI centile is a simple and reliable indicator of thinness and fatness inchildhood. Where severe over- or underweight is a concern, or where there is aneed for monitoring over time, BMI can be calculated and plotted on this is important also to plot the height and weight separately on the main 2-18chart. There is also a BMI centile look-up on the standard 2-18 chart for lesscomplex cases. BMI is calculated by dividing weight (in kg) by the square of height (in metres m, not centimetres 132 cm).A simple way to do this on a calculator or mobile phone is:1. Enter the weight. 2. Divide by height. 3. Divide the result by result can then be plotted on the chart and obesityA BMI above the 91st centile suggests overweight.
2 A child above the 98th centileis very overweight (clinically obese) while a BMI above the centile is severelyobese. In addition to the usual nine centile lines, the BMI chart displays high linesat +3, + , + and + 4 SD, which can be used to monitor the progress ofchildren in overweight treatment BMI below the 2nd centile is unusual and may reflect undernutrition, but maysimply reflect a small build. The chart also displays low lines at -4 and -5 SD forthose who are severely underweight. Children whose BMI lies below the are likely to have additional problems and if not already receiving medicalor dietetic attention should be Recording Recording DateWeightLength/HeightBMIL ocationHealth worker nameMeasurement 1 Recording DateWeightLength/HeightBMIL ocationHealth worker nameMeasurement 3 Recording DateWeightLength/HeightBMIL ocationHealth worker nameMeasurement 5 Recording DateWeightLength/HeightBMIL ocationHealth worker nameMeasurement 7 Recording DateWeightLength/HeightBMIL ocationHealth worker nameMeasurement 9 body mass index (kg/m2)
3 5049484746454443424140393837363534333231 3029282726252423222120191817161514131211 1098234567891011121314151617181920324567 891011121314151617181920 Copyright RCPCH 2013 Age in yearsAge in years+ +3SD+4SD+3SD+ + + 2 Recording DateWeightLength/HeightBMIL ocationHealth worker nameMeasurement 4 Recording DateWeightLength/HeightBMIL ocationHealth worker nameMeasurement 6 Recording DateWeightLength/HeightBMIL ocationHealth worker nameMeasurement 8 Recording DateWeightLength/HeightBMIL ocationHealth worker nameMeasurement 10 Recording DateWeightLength/HeightBMIL ocationHealth worker nameTransit pointfrom UK-WHOto UK90 (obese)OverweightLowBMIM orbidlyobese+ UKBody mass index (BMI)2-20 yearsPlease place sticker (if available) otherwise write in space :_____NHS/CHI No:Hospital No:Date of Birth: Copyright RCPCH 2013 body mass index (kg/m2)504948474645444342414039383736353 4333231302928272625242322212019181716151 4131211109823456789101112131415161718192 0324567891011121314151617181920 Age in yearsAge in years+3SD+ + + 1 May 13 VerythinLowBMIS everelyobeseVeryoverweight(obese)Overwei ghtMorbidlyobeseThe BMI centile is a simple and reliable indicator of thinness and fatness inchildhood.
4 Where severe over- or underweight is a concern, or where there is aneed for monitoring over time, BMI can be calculated and plotted on this is important also to plot the height and weight separately on the main 2-18chart. There is also a BMI centile look-up on the standard 2-18 chart for lesscomplex cases. BMI is calculated by dividing weight (in kg) by the square of height (in metres m, not centimetres 132 cm).A simple way to do this on a calculator or mobile phone is:1. Enter the weight. 2. Divide by height. 3. Divide the result by result can then be plotted on the chart and obesityA BMI above the 91st centile suggests overweight. A child above the 98th centileis very overweight (clinically obese) while a BMI above the centile is severelyobese. In addition to the usual nine centile lines, the BMI chart displays high linesat +3, + , + and + 4 SD, which can be used to monitor the progress ofchildren in overweight treatment BMI below the 2nd centile is unusual and may reflect undernutrition, but maysimply reflect a small build.
5 The chart also displays low lines at -4 and -5 SD forthose who are severely underweight. Children whose BMI lies below the are likely to have additional problems and if not already receiving medicalor dietetic attention should be Recording Recording DateWeightLength/HeightBMIL ocationHealth worker nameMeasurement 1 Measurement 2 Recording DateWeightLength/HeightBMIL ocationHealth worker nameRecording DateWeightLength/HeightBMIL ocationHealth worker nameMeasurement 4 Recording DateWeightLength/HeightBMIL ocationHealth worker nameMeasurement 3 Recording DateWeightLength/HeightBMIL ocationHealth worker nameMeasurement 6 Recording DateWeightLength/HeightBMIL ocationHealth worker nameMeasurement 5 Recording DateWeightLength/HeightBMIL ocationHealth worker nameMeasurement 8 Recording DateWeightLength/HeightBMIL ocationHealth worker nameMeasurement 7 Recording DateWeightLength/HeightBMIL ocationHealth worker nameMeasurement 10 Recording DateWeightLength/HeightBMIL ocationHealth worker nameMeasurement 9 Transit pointfrom UK-WHOto
6 UK90 data.+3SD+ + +4SD