Example: air traffic controller
Graphing Sunspot Numbers
6. Estimate the dominant period of the sunspot signal. Explain and show your calculations below. 7. During the next 15 years about when do you expect the solar activity to be high
Tags:
Information
Domain:
Source:
Link to this page:
Documents from same domain

September 2016 Newsletter Volume 2 Number 1
d32ogoqmya1dw8.cloudfront.net1 September 2016 Newsletter Volume 2 Number 1 TED’s President olumn By Jeff Thomas Dear TED Members: Let me start by welcoming all new and returning TED members, and I …

GEL 120 - PHYSICAL GEOLOGY LABORATORY
d32ogoqmya1dw8.cloudfront.netgel 120 – physical geology laboratory fall semester 2011 natural sciences/health & pe department mathematics and sciences division ... your laboratory manual to class.

GEOL 1301 – NATURAL HAZARDS AND DISASTERS
d32ogoqmya1dw8.cloudfront.netGEOL 1305 Syllabus – Fall 2009 – Page 3 Late assignments placed in the instructorʼs mailbox in the campus administration area MUST have the date of receipt stamped on them by the administrative assistant in the mailroom.

Berquist Thomas Nelson Community College
d32ogoqmya1dw8.cloudfront.netPete Berquist Thomas Nelson Community College Most students enrolled in my geology courses may never take a science class ever again, yet I find it likely …

Earth Science Introduction
d32ogoqmya1dw8.cloudfront.netGLOBE® 2003 Introduction - 6 Earth System Science Components of the Earth System The GLOBE program has students take measure-ments of many parts of the Earth’s systems. The table below indicates where the GLOBE investiga-tions lie with the components of the Earth system.

INTRODUCTION TO EARTH SCIENCE
d32ogoqmya1dw8.cloudfront.netObjectives: Introduction to Earth Science will expose you, the student, to the principles that underlie our understanding of how and why the Earth evolves. You …
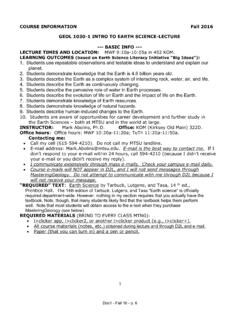
COURSE INFORMATION Fall 2016 GEOL 1030-1 INTRO TO …
d32ogoqmya1dw8.cloudfront.netGEOL 1030-1 INTRO TO EARTH SCIENCE-LECTURE --- BASIC INFO --- LECTURE TIMES AND LOCATION: MWF 9:10a-10:05a in 452 KOM. ... If you miss a lecture, obtain notes and/or handouts from a student who was there. Absences for university sponsored events (e.g., athletics and

Syllabus for Earth Science
d32ogoqmya1dw8.cloudfront.net4 credits (3 lecture hours, 2 lab hours) Instructor: Joy Branlund ... You will be able to use YOUR notes (but no book, photocopied, borrowed or shared notes) for the Prep Checks. Homework (some completed in-class) ... Syllabus for Earth Science ...

Overview of the Research Methods Used by Geoscience ...
d32ogoqmya1dw8.cloudfront.netSolutions • Establish and communicate norms for geoscience education research • GSA session to share methods and techniques Purpose • Provide overview of education research and framework to

Practice Problems on Unit Conversion Using Dimensional ...
d32ogoqmya1dw8.cloudfront.net1 inch = 2.54 cm exactly 1 lb = 454 g 1 qt = 0.946 L 1 mi = 5280 ft 1 qt = 2 pt 4qt = 1 gal You should also remember that 1 cc = 1 cm3 = 1 mL exactly. (This is a conversion you need to know.) For all problems, please show your dimensional analysis setup and give your answer to the correct significant figures. ...
Related documents

Millennium-Scale Sunspot Number Reconstruction: Evidence ...
cc.oulu.fireconstruct the average sunspot activity level for the period between the year 850 to the present. Our method uses physical models for processes connecting the 10 Be concentration with the sunspot number.

Lesson Summary Teaching Time Students graph data for the ...
lasp.colorado.eduStudents graph data for the number of sunspots ... sites in activity #2, students will write a poem about sunspots. See Internet site #11–Solar poetry. ... order to complete the sunspot viewer review. See Internet site #2. 8. Sunspot Viewer Review Student worksheet …

Dependence of Time Derivative of Horizontal Geomagnetic ...
article.sapub.orgTime derivative of horizontal geomagnetic field (dH/dt) used as proxy for geomagnetic induced current (GIC), exhibited high positive correlation with sunspot number (0.86) and aa index (0.8998). 92.665% of the obtained geomagnetic activity is explicable by the combined effect of sunspot number …
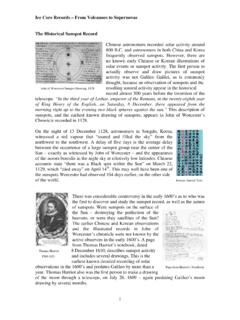
The Historical Sunspot Record - Chandra X-ray Observatory
chandra.harvard.eduThe Historical Sunspot Record ... Thomas Harriot 8 December 1610, describes sunspot activity . 1560-1621 and includes several drawings. This is the . earliest known detailed recording of solar . ... He left a large number of manuscripts on various scientific subjects, and over the past ...
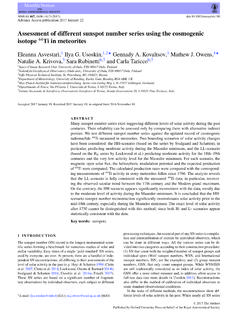
Assessment of different sunspot number series using the ...
cc.oulu.fi(1) SN that count both the weighted number of sunspot groups and individual spots (Wolf sunspot numbers, WSN, and International sunspot numbers, ISN, are the examples); and (2) group sunspot

ACTIVITY 2: SUNSPOT NUMBER VARIATIONS Guide to …
mrscienceut.netAs it is written, the activity for plotting sunspot numbers takes a class of 30 students, who meet in 45 minute periods, about three or four days to complete. To reduce the amount of

SUNSPOTS 2011 NAME PD Astronomy
blog.yssd.orgQuestions (Attach finished graph to this paper) 1. On the data table, shade the boxes with the year and number of each maximum.Use a red colored pencil. (Example – shade the boxes with the year - 1937 and the sunspot number of 114).
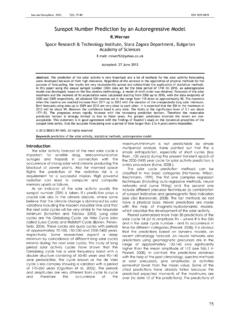
Sunspot Number Prediction by an Autoregressive Model
newserver.stil.bas.bgIn this paper using the annual sunspot number (SSN) data set for the time period of 1749 till 2010, an autoregressive model was developed, based on the Box-Jenkins methodology. A …

Sunspots, GDP and the stock market - growth-dynamics.com
growth-dynamics.comobserved) that an 11-year average wash out the ups and downs of the sunspot activity. On the DJIA data, the 11-year average outlined two well-defined S-shaped steps punctuated by the mid 1970s.

her eac y T er v e Disco Climat s Guide - eo.ucar.edu
eo.ucar.eduGraphing Sunspot Cycles Climate Discovery Teacher’s Guide National Center for Atmospheric Research e g Little Ice A n o s s e L 7 e g a P 3 e er e w her e cooled when t he climat hat t ecognized t y r e hopefull v tudents ha oup.
Related search queries
Sunspot number, Sunspot activity, Students graph data for the, Students graph data for the number of sunspots, Activity, Sunspot, Time Derivative of Horizontal Geomagnetic, Time derivative of horizontal geomagnetic field, The Historical Sunspot Record, Number, Assessment of different sunspot number series using, ACTIVITY 2: SUNSPOT NUMBER VARIATIONS, SUNSPOTS 2011 NAME PD Astronomy, Sunspot Number Prediction by an Autoregressive Model, Sunspots, GDP and the stock market