Transcription of H1 2021 Solar Industry Update
1 H1 2021. Solar Industry Update David Feldman Kevin Wu Robert Margolis June 22, 2021. NREL/PR-7A40-80427. Executive Summary Global Solar Deployment In a select data set of utility-scale PV systems owned by 25 regulated utilities, the median system price in 2020 was $ ($ ) flat y/y in WattsAC but an From 2010 to 2020, global PV capacity additions grew from 17 GWDC to 139 GWDC. 8% decrease in WattsDC that was due to increased ILR. At the end of 2020, global PV installations reached 760 GWDC. Analysts project increased annual global PV installations over the next 2 Mono c-Si PV module prices rose 17% in the first half of 2021, to $ a price years, with continued growth in China, the United States, Europe, and India. not seen since 2019. A large reason for this is because polysilicon, the key In 2020, approximately 100 MW of CSP was added in China and another GW feedstock to most PV modules, was up 169% in H1 2021 and 352% y/y, to $ was under construction at the end of the year.
2 At the end of June; prices were as low as $ in May and June of 2020. In Q1 2021, mono c-Si module prices were still 55% above global ASP. PV Deployment The United States installed GWAC ( GWDC) of PV in Q1 2021 its largest Q1 Global Manufacturing total ever. In 2020, global PV shipments were approximately 132 GW an increase of 7% from At the end of 2020, there were approximately million residential PV systems in 2019. the United States. In 2020, 88% of PV shipments were mono c-Si technology, compared to 35% in SEIA reported that in 2020 the community Solar market installed 826 MWDC of 2015 (when multi peaked at 58%). community Solar installations a 30% increase y/y bringing cumulative capacity to 3 GWDC. In 2020, average module efficiency of modules installed in the United States was approximately for mono c-Si, for multi c-Si, and for CdTe. Based on EIA's Short-Term Energy Outlook, annual PV and wind deployment will grow 34% and 8% respectively in 2021 from the record-setting levels achieved in Module and cell imports into the United States picked up significantly in March 2020.
3 And April 2021; the first 4 months of the 2021 had a flat level of PV imports, y/y ( GW). PV System and Component Pricing Median reported price by EnergySage for residential PV systems decreased between H2 2019 and H2 2020 the largest decrease since 2017. NREL | 2. A list of acronyms and abbreviations is available at the end of the presentation. Agenda 1 Global Solar Deployment 2 PV Deployment 3 PV System Pricing 4 Global Manufacturing 5 Component Pricing 6 Market Activity PV Price Increases NREL | 3. From 2010 to 2020, global PV capacity additions grew from 1 Global Solar Deployment 17 GWDC to 139 GWDC. At the end of 2020, global PV installations reached 760 GWDC. 2 PV Deployment Q1 2021 PV installations increased significantly, y/y, for 3 PV System Pricing many leading markets. From Q1 2020 to Q1 2021, installs in China, the United States, and 4 Global Manufacturing Germany increased 35% 45%, and installs in India increased 89%.
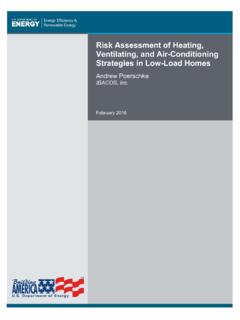
4 Analysts project increased annual global PV installations 5 Component Pricing over the next 2 years, with continued growth in China, the United States, Europe, and India. 6 Market Activity In 2020, approximately 100 MW of CSP was added in China. PV Price Increases NREL | 4. Global Annual PV Capacity Additions by Country From 2010 to 2020, global PV capacity additions grew from 17 GWDC to 139 GWDC. 160. Rest of World The COVID-19 pandemic did not significantly 140 impact Solar deployment in 2020, with countries Rest of Europe installing more in H2 after lockdowns were lifted. PV Annual Installations (GWDC). 120 Germany European markets led in the beginning of the decade, United States 100 but PV growth transitioned to Asia. India At the end of 2020, 57% of cumulative PV. 80 Japan installations were in Asia, 22% were in Europe, and China 15% were in the Americas. 60. The United States is the country with the second- 40 largest cumulative installed PV capacity.
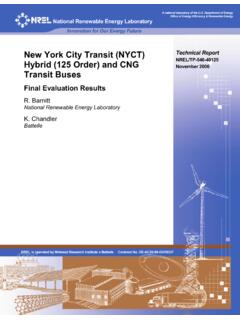
5 Brazil ( GWDC) and Mexico ( GWDC) joined the 20 United States as the only countries in the Western Hemisphere to install more than 1 GW of PV in 2020. 0 A recent surge of ROW installations indicates the 2010 2011 2012 2013 2014 2015 2016 2017 2018 2019 2020 globalization of PV. NREL | 5. Sources: IEA, Snapshot of Global PV Markets: 2021; PVPS Snapshot 2020; Trends in Photovoltaic Applications 2019. China's annual PV installations grew 60% y/y in 2020, Top PV Markets representing more than one-third of annual global deployment. In 2020, the United States was the country with the At the end of 2020, global PV installations reached 760 GWDC, an annual second-largest PV market in terms of both cumulative increase of 139 GWDC from 2019. and annual installations. The leading five markets in cumulative PV installations at the end of 20 countries installed more than 1 GW of PV in 2020, 2020 were China, the United States, Japan, Germany, and India.
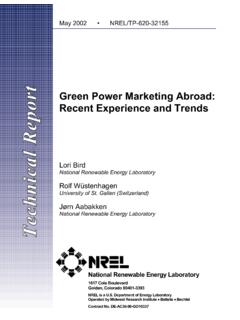
6 And 14 countries now have more than 10 GW of Vietnam, with more than 11 GW of installations in 2020, bumped cumulative capacity. India out of the top five for annual deployment. Cumulative PV Deployment, 2020 (760 GWDC) Annual PV Deployment, 2020 (139 GWDC). 300 60. 253. 250 50. 200 40. 150 30. 93 91 100 71 20. 54 62 47 50 22 20 16 16 10 14 0 0. NREL | 6. Source: IEA, Snapshot of Global PV Markets: 2021. The United States, despite being a leading PV market, is Global PV penetration below this average and other leading markets in terms of PV generation as a percent of total country electricity generation, with IEA estimates that in 2020, of global electricity generation If California were a country, its PV contribution came from PV. ( ) would be the highest. 14%. Percentage of Annual Electricity Generation 12%. 10%. 8%. 6%. 4%. 2%. 0%. Netherla . Switzerla . Bulgaria Australia Greece India EU.
7 Turkey USA. Austria Romania Malaysia Sweden Morocco Canada Italy Israel S. Korea Portugal Slovakia Denmark Belgium China Czech Rep. Finland Honduras Spain Japan Mexico France S. Africa Norway Germany World Chile UK. Thailand NREL | 7. Sources: IEA, Snapshot of Global PV Markets: 2021; Energy Information Administration (EIA), Electricity Data Browser. Accessed March 10, 2021. International Q1 2021. Installations Q1 2021 PV installations increased 10 significantly, y/y, for many leading markets. 48 GW 19 GW. 9. Q2-Q4. From Q1 2020 to Q1 2021, installs in 8 China, the United States, and Germany installs increased 35% 45%, and installs Installations (GWDC). 7 Q1. 6 in India increased 89%. 5. Analysts attributed India's large increase 4. to developers finishing delayed 2020. 3 projects. 2. 1 Despite the growth in installations, it is not 0 necessarily indicative of 2021 as a whole. 2020 2021 2020 2021 2020 2021 2020 2021 2020 2021.
8 A significant portion of deployment often Australia China Germany India comes toward the end of the year. Significant supply constraints, increased costs, and resurgent waves of the pandemic (particularly in India) might suppress installations. Sources: Australian Photovoltaic Institute. IEA, Snapshot of Global PV Markets: 2021. Mercom (05/03/21 05/31/21). NREL | 8. Wood Mackenzie/SEIA: Solar Market Insight: Q2 2021. Annual Global PV Demand 250 Analysts project increased annual global PV installations ROW over the next 2 years, with continued growth in China, the Japan United States, Europe, and India. 200 India PV Annual Installations (GWDC). The median estimate of 2021 global PV system Europe deployment projects a 17% y/y increase to 150 China approximately 163 GWDC. The median estimate of 2022 global PV system 100 deployment projects another 5% y/y increase to approximately 172 GWDC.
9 50. 0. 2019 2020 2021P 2022P. Notes: P = projection. Bar represents median projection. Error bars represent high and low projections. Not all sources have data for all categories. Sources: BNEF, 2Q 2021 Global PV Market Outlook, 05/21/21; IEA, Renewable Energy Market Update : Outlook for 2021 and 2022. Goldman Sachs Equity Research. Americas Clean Technology: Solar NREL | 9. 2021 Outlook. 01/04/21. IHS Markit Research (03/31/21). IEA, Snapshot of Global PV Markets: 2021. Global CSP Installed 8 From 2010 to 2020, cumulative global CSP installations increased by almost 6X. 7 Initially most of the growth came from Spain and the Cumulative Installations (MWAC). Other United States. 6. From 2015 to 2020, approximately 2 GW of CSP was China 5 installed in other parts of the world, particularly the Middle East Middle East, North Africa, and China. 4 South Africa There is also some development in other parts of the world, such as South America.
10 3 Morocco In 2020, approximately 100 MW of CSP was added in 2 Spain China. 1. 0. 2010 2011 2012 2013 2014 2015 2016 2017 2018 2019 2020. NREL | 10. Sources: BNEF, Capacity & Generation data set. Accessed June 2, 2021. Global CSP Pipeline BNEF reports a CSP pipeline of GW: GW is under construction. GW is permitted. GW has been announced. CSP Capacity (GW). In the near term, CSP projects are primarily expected to be built in Chile, China, and the Middle East. In the longer term, significantly more projects are planned in China and the Middle East. Chile China Middle East South Africa Other Financing secured / under construction Permitted Announced / planning begun Note: Pipeline is defined as active projects in BNEF's database that have: secured financing or are under construction; received permit(s) for construction; or been announced and planning has begun. Timelines vary by the circumstances of individual CSP projects, however each step can take two years, or six years in total.