Transcription of Homework Assignment 4
1 Homework Assignment 4 Carlos M. CarvalhoMcCombs School of BusinessProblem 1 Suppose we are modeling house price as depending on house size, the number of bedroomsin the house and the number of bathrooms in the house. Price is measured in thousands ofdollars and size is measured in thousands of square our model is:P= 20 + 50 size + 10 nbed + 15 nbath + , N(0,102).(a) Suppose you know that a house has size = , nbed = 3, and nbath = is the distribution of its price given the values for size, nbed, and nbath.(hint: it is normal with mean = ?? and variance = ??)20 + 50 + 10 3 + 15 2 = 160P= 160 + so thatP N(160,102)(b) Given the values for the explanatory variables from part (a), give the 95% predictiveinterval for the price of the 20(c) Suppose you know that a house has size = , nbed = 4, and nbath =3.
2 Give the95% predictive interval for the price of the + 50 + 10 4 + 15 3 = 235P= 235 + so thatP N(235,102) and the 95% predictive interval is235 20(d) In our model the slope for the variable nbath is 15. What are the units of thisnumber?Thousands of dollars per (e) What are the units of the intercept 20? What are the units of the the error standarddeviation 10?The intercept has the same units in this case, thousands of dollars. The error stddeviation is also in the same units asP, ie, thousands of 2 For this problem us the data is the are 18 observation corresponds to a project developed by a = Profit: profit on the project in thousands of RD: expenditure on research and development for the project in thousands of : a measure of risk assigned to the project at the want to see how profit on a project relates to research and development expenditureand risk.
3 (a) Plot profit vs. each of the twoxvariables. That is, do two plots y vs. x1 and yvs x2. You can t really understand the full three-dimensional relationship from thesetwo plots, but it is still a good idea to look at them. Does it seem like the y is relatedto the x s?(b) Suppose a project has risk=7 and research and development = 76. Give the 95%plug-in predictive interval for the profit on the project. Compare that to the correct,predictive interval (using the predict function in R).(c) Suppose all you knew was risk=7. Run the simple linear regression of profit on riskand get the 68% plug-in predictive interval for profit.(d) How does the size of your interval in (c) compare with the size of your interval in (b)?
4 What does this tell us about our variables?(a)It seems like there is some relationship, especially between RD and profit.(b)The plug-in predictive interval, whenRD= 76 andRISK= 7 is 2 =[ , ].(c)Using the modelPROFIT= 0+ 1 RISK+ , the 68% plug-in prediction interval forwhenRISK= 7 is 143 = [ , ].3(d)Our interval in (c) is bigger than the interval in (b) despite the fact that it is a weaker confidence interval. In essence (c) says that we predictYwill be in [38,250] 68% ofthe time whenRISK= 7. In contrast, (b) says thatYwill be in [63,127] 95% ofthe time whenRISK= 7 andRD= 76. UsingRDin our regression narrows ourprediction interval by quite a 3 The data for this question is in the The data is from the Zagat restaurantguide.
5 There are 114 observations and each observation corresponds to a are 4 variables:price: the price of a typical mealfood: the zagat rating for the quality of : the zagat rating for the quality of : the zagat rating for the quality of the want to see how the price of a meal relates the quality characteristics of the restaurantexperience as measured by the variables food, service, and decor.(a) Plot price vs. each of the three x s. Does it seem like our y (price) is related to thex s (food, service, and decor) ?(b) Suppose a restaurant has food = 18, service=14, and decor=16. Run the regressionof price on food, decor, and service and give the 95% predictive interval for the priceof a meal.
6 (c) What is the interpretation of the coefficient estimate for the explanatory variable foodin the multiple regression from part (b) ?(d) Suppose you were to regress price on the one variable food in a simple linear regression?What would be the interpretation of the slope? Plot food vs. service. Is there arelationship? Does it make sense? What is your prediction for how the estimatedcoefficient for the variable food in the regression of price on food will compare to theestimated coefficient for food in the regression of price on food, service, and decor?Run the simple linear regression of price on food and see if you are right! Why arethe coefficients different in the two regressions?
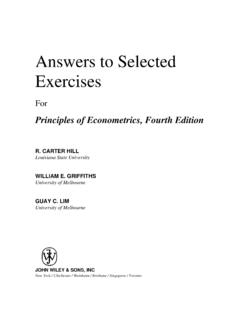
7 (e) Suppose I asked you to use the multiple regression results to predict the price of ameal at a restaurant with food = 20, service = 3, and decor =17. How would you feelabout it? (a)Plot price vs. each of the three x it seem like our y (price) is related to the x s (food, service, and decor) ?!!!!!!!!!!!!!!!!!!!!!!!!!!!!!!!!!!!!!!! !!!!!!!!!!!!!!!!!!!!!!!!!!!!!!!!!!!!!!!! !!!!!!!!!!!!!!!!!!!!!!!!!!!!!!!!!!!14161 820222426102030405060zd$foodzd$price!!!! !!!!!!!!!!!!!!!!!!!!!!!!!!!!!!!!!!!!!!!! !!!!!!!!!!!!!!!!!!!!!!!!!!!!!!!!!!!!!!!! !!!!!!!!!!!!!!!!!!!!!!!!!!!!!!1015202510 2030405060zd$servicezd$price!!!!!!!!!!!! !!!!!!!!!!!!!!!!!!!!!!!!!!!!!!!!!!!!!!!! !!!!!!!!!!!!!!!!!!!!!!!!!!!!!!!!!!!!!!!! !
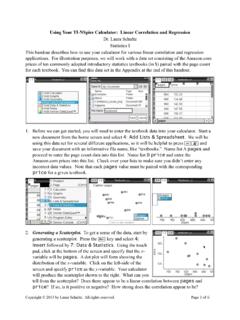
8 !!!!!!!!!!!!!!!!!!!!!5101520251020304050 60zd$decorzd$priceDefinitely looks like price is related to each of our 3 x s.(b)Suppose a restaurant has food = 18, service=14, and decor= the regression of price on food, decor, and service and give the 95% plug-in predictiveinterval for the price of a Std. Error t value Pr(>|t|)(Intercept) **food **decor **service **---Signif. codes: 0 ** ** * . 16 Solutions.(a) Check out the figure definitely looks like price is related to each of the 3 X s.(b) The regression output isESUMMARY OUTPUTR egression StatisticsMultiple Errort StatP-valueLower 95%Upper 95% that + 18 + 16 + 14 = and the 95% plug-inprediction interval is (c) If you hold service and decor constant and increase food by 1, then price goes up (onaverage) by (d) If food goes up by 1 price goes up by the slope (on average).
9 From the plot in item(a) we know that it looks like food and price are related in a positive way. Now, youwould think that these four variables are somewhat related to each other, right? Abetter restaurant tend to have good food, service and and also a higher running the regression with only food as a explanatory variable I would guess thecoefficient for food would be let s see:6 SUMMARY OUTPUTR egression StatisticsMultiple R Errort StatP-valueLower 95%Upper 95% was right! In the simple linear, regression food works as a proxy for the overallquality of a restaurant. When food goes up service and decor tend to go up as wellbut since they are not in the regression, the coefficient for food has to reflect the otherfactors.
10 Once decor and service are in the regression, the coefficient for food just hasto reflect the impact associated with food but not with the other variables.(e) Very bad! We just dont see in our data restaurants with that low of a service ratinggiven food equal to 20 and decor equal to 17. This would be a extreme extrapolationfrom what we have seen so far and the model might not be 4: BaseballUsing our baseball data ( ), regressR/Gon a binary variable for leaguemembership (League = 0 if National and League = 1 if American) 0+ 1 League+ 2 OBP+ 1. Based on the model assumptions, what is the expected value ofR/GgivenOBPforteams in the AL? How about the NL?2. Interpret 0, 1and After running the regression and obtaining the results, can you conclude with 95%probability that the marginal effect ofOBPonR/G(after taking into account theLeague effect) is positive?