Transcription of Using Your TI-NSpire Calculator: Linear Correlation and ...
1 Using Your TI-NSpire Calculator: Linear Correlation and RegressionDr. Laura SchultzStatistics IThis handout describes how to use your calculator for various Linear Correlation and regression applications. For illustration purposes, we will work with a data set consisting of the prices of ten commonly adopted introductory statistics textbooks (in $) paired with the page count for each textbook. You can find this data set in the Appendix at the end of this handout. we can get started, you will need to enter the textbook data into your calculator. Start a new document from the home screen and select 4: Add Lists & Spreadsheet. We will be Using this data set for several different applications, so it will be helpful to press / and save your document with an informative file name, like textbooks.
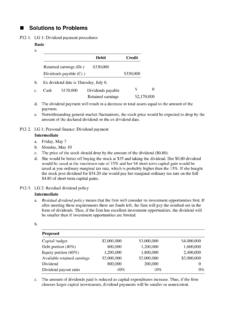
2 Name list A pages and proceed to enter the page count data into this list. Name list B price and enter the prices into this list. Check over your lists to make sure you didn t enter any incorrect data values. Note that each pages value must be paired with the corresponding price for a given textbook. a Scatterplot. To get a sense of the data, start by generating a scatterplot. Press the ~ key and select 4: Insert followed by 7: Data & Statistics. Using the touch pad, click at the bottom of the screen and specify that the x-variable will be pages. A dot plot will form showing the distribution of the x-variable. Click on the left-side of the screen and specify price as the y-variable.
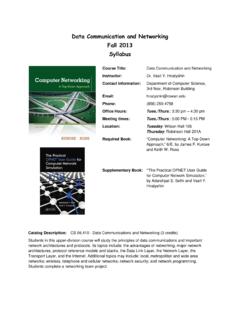
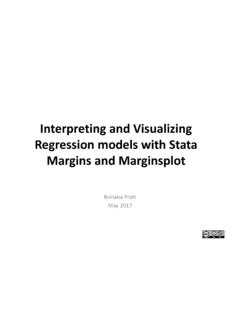
3 Your calculator will produce the scatterplot shown to the right. What can you tell from the scatterplot? Does there appear to be a Linear Correlation between pages and price? If so, is it positive or negative? How strong does the Correlation appear to be? Copyright 2013 by Laura Schultz. All rights reserved. Page 1 of 6 next step is to find the Linear Correlation coefficient (r) and the Linear regression equation. The Linear Reg t Test command on your calculator provides one-stop shopping for answering these and other questions relating to Linear Correlation and regression. Press the ~ key and select 4: Insert followed by 3: Calculator. Press b and select 6: Statistics followed by 7: Stat Tests.
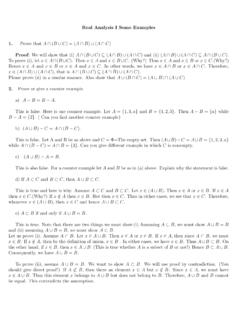
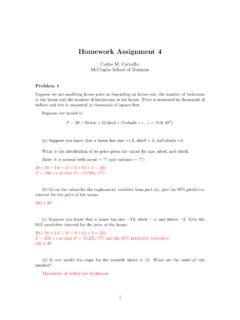
4 Choose option A: Linear Reg t Test. will be prompted for the following information: X List: Enter the name of the list containing the predictor (x) variable. For this example, select pages and press e. Y List: Enter the name of the list containing the response (y) variable. For this example, select price and press e. Save RegEqn to: Here you can specify one of the built-in functions as a place to store the regression equation that is generated. Doing so will allow you to use the regression equation to make predictions later on. Alternate Hyp: Select the desired alternative hypothesis. (The model utility test for simple Linear regression is covered by the Statistics II course at Rowan.)
5 For our purposes, select Ha: & 0 and press e. Highlight OK and press . calculator will return two screens full of output; use the touch pad arrow keys to scroll through all of the output. Let s start by finding the Linear Correlation coefficient (r) for our data. You will need to scroll down to the bottom of the second screen to find r. For this example, r = What does r tell us? First of all, its sign tells us that there likely is a negative Correlation between page count and the price of introductory statistics textbooks sold by The slope of the regression line will also be negative. Second, because r is fairly close to -1, we can conclude that there is a moderately strong negative Correlation displayed by our sample data.
6 Copyright 2013 by Laura Schultz. All rights reserved. Page 2 of 6 model utility test asks whether there a useful Linear relationship between the page count of an introductory statistics textbook and its price on That is, can we conclude that the slope ( ) of the population regression line is not equal to 0? The Linear regression t test calculator output can be used to address this question. You would report the results of the t test for this example as t8 = , P = .0130 (two-tailed). Note that I reported the degrees of freedom as a subscript (df = n - 2). Round the t-test statistic to 4 decimal places and the P-value to 3 significant figures. Given that the P-value is less than the significance level of =.
7 05, we can conclude that there is a useful Linear relationship between the page count of an introductory statistics textbook and its price on (The details of the model utility test for simple Linear regression are covered by Rowan s Statistics II course; we will not use this test in Statistics I.) coefficient of determination (r2) tells us how much of the variability in y can be explained by the Linear relationship between x and y. By convention, r2 is reported as a percentage. For our example, r2 = What does this mean? of the observed variability in introductory statistics textbook prices on can be attributed to the Linear relationship between the page count and the textbook can also use the calculator output to construct the Linear regression equation for our data.
8 There are two methods for doing so. First, note that the previous calculator displays indicate that ReqEqn = a + b x. Your calculator reports values for both a (the y-intercept) and b (the slope). The regression equation will also be displayed when you add a regression line to your scatterplot. In either case, round the y-intercept and slope values to one more decimal place than you started with for y when you report the Linear regression equation. The Linear regression equation for our sample data is y= that the previous output screen also included the standard deviation of the residuals (se in textbook; s on calculator display), also referred to as the standard error of the estimate.
9 For our data set, s = $ (Note that s has the same units as y.) What does this mean? The typical discrepancy between an observed textbook price and the value predicted by the regression equation is $ is the marginal change in textbook price for each additional page? marginal change is simply the slope of the regression line. Hence, the marginal change for our example is dollars/page. In other words, the price of an introductory statistics textbook decreases by an average of $ for each additional 2013 by Laura Schultz. All rights reserved. Page 3 of s add a regression line to the scatterplot. Use the touch pad to navigate to the screen containing your scatterplot ( ).
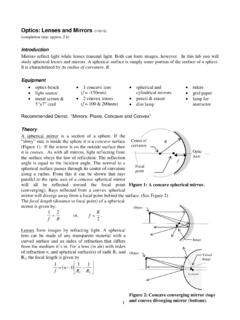
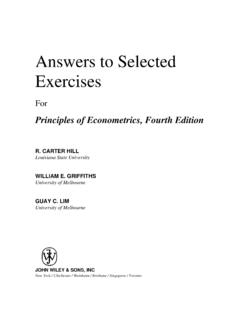
10 Then, press b and select 4: Analyze followed by 6: Regression. Choose option 2: Show Linear (a +bx). Your calculator will return the scatterplot with the regression line in place and also report the regression equation. Note how well the regression line fits our data. The stronger the Linear Correlation , the closer the data points will cluster along the regression line. predictions from a regression equation. Let s use the regression equation to predict what the price would be for an introductory statistics textbook with 850 pages. Use the touch pad to return to your calculator window (or add a new calculator window). Press the h key and select the function where you stored the regression equation; I used f1.