Transcription of Hurricane Charley, August 9-15, 2004
1 Service Assessment Hurricane Charley, August 9-15, 2004 DEPARTMENT OF COMMERCE National Oceanic and Atmospheric Administration National Weather Service Silver Spring, Maryland ii Cover: Reflectivity image from the WSR-88D located at the Weather Forecast Office in Tampa, FL taken at 1956 UTC, August 13, 2004 as Hurricane Charley made landfall. iii Service Assessment Hurricane Charley August 9-15, 2004 January 2006 NOAA s National Weather Service Brigadier General David L. Johnson, USAF (Ret.) Assistant Administrator for Weather Services iv Preface Hurricane Charley made landfall on the southwest coast of Florida near Cayo Costa, just west of Ft. Myers around 3:45 EDT on August 13, with maximum sustained surface winds near 150 mph. This made Charley a category 4 storm on the Saffir-Simpson Scale. The maximum storm surge associated with Charley was six to seven feet on Sanibel and Estero Islands.
2 This was less than expected due to a number of factors including an increase in the storm s speed, the eyewall shrinking, and the tide receding. Charley then moved north-northeastward causing significant damage across the Florida peninsula from Punta Gorda, Port Charlotte, Orlando, to Palm Coast (north of Daytona Beach). Charley caused ten direct fatalities in the and an estimated $14 billion in economic losses. It was a harbinger of things to come, being the first of four hurricanes to affect Florida in August and September of 2004. This assessment evaluates the service of the National Oceanic and Atmospheric Administration s (NOAA) National Weather Service (NWS) before and during the landfall of Hurricane Charley and provides recommendations to improve services in the future. It takes into consideration the affected audiences in the media and emergency management communities as well as the public. Service assessments significantly enhance ongoing efforts to improve the quality, timeliness, and value of NWS products and services.
3 Findings of this assessment will further NOAA s goal to serve society s needs for water and weather information. Brigadier General David L. Johnson, USAF (Ret.) Assistant Administrator for Weather Services January 2006 v Table of Contents iv Service Assessment vi Executive Summary .. 1 Service Assessment 2 2 Hurricane Forecast Track and Intensity .. 3 Figure 1 Three-Day Hurricane Forecast Graphic .. 4 WFO Operations and 6 Figure 2 Wind Speed and Direction 7 Other NOAA Offices Assisting NWS Operations and Services .. 9 Internet 11 Conclusion .. 12 Best Practices .. 14 Appendix A The Saffir-Simpson Hurricane A-1 Appendix B Track, Intensity, Verification, and Landfall Data for Charley .. B-1 vi Service Assessment Team An assessment team was activated on August 20, 2004. The team assembled at the Weather Forecast Office (WFO) in Miami, FL on Tuesday, August 24, 2004. During August 25-29, team members visited four Florida WFOs located in Key West, Miami, Melbourne, and the Tampa area; the Tropical Prediction Center (TPC)/National Hurricane Center (NHC); and damage areas.
4 They interviewed Federal, State and County emergency managers, media outlets, and the public in Florida. On September 1, 2004, the Team Leader visited the Southern Regional Headquarters (SRH) Regional Operations Center (ROC) to review their operations. In addition, the Team Leader conducted a review of Hurricane Charley operations at the Southeast River Forecast Center (SERFC) via phone on August 31, 2004. The team was comprised of the following members: Jim Weyman Team Leader, Meteorologist in Charge (MIC), WFO Honolulu, Hawaii and Director, Central Pacific Hurricane Center, Honolulu, Hawaii Frank Marks Director, Hurricane Research Division Atlantic Oceanographic and Meteorological Laboratory Office of Oceanic and Atmospheric Research Miami, Florida Jim Duke MIC, WFO Memphis, Tennessee Gary Woodall Warning Coordination Meteorologist (WCM), WFO Fort Worth, Texas John Cole WCM, WFO Newport/Morehead City, North Carolina Reid Hawkins Science and Operations Officer (SOO)
5 , WFO Wilmington, North Carolina Dan Nietfeld SOO, WFO Omaha, Nebraska Ron Trumbla NOAA Public Affairs, Fort Worth, Texas Brian LaMarre Marine and Coastal Services Program Manager, Office of Climate, Water, and Weather (OCWWS), National Weather Service (NWS) Headquarters, Silver Spring, Maryland vii Betty Morrow Social Scientist, Professor Emeritus at Florida International University (Miami) and former Director, Laboratory for Social and Behavior Research at the International Hurricane Research Center Other valuable contributors include: Aimee Devaris Performance Branch Chief, OCWWS, NWS Headquarters, Silver Spring, Maryland Wayne Presnell Service Assessment Program Leader, OCWWS, NWS Headquarters, Silver Spring, Maryland Scott Kiser Tropical Weather Services Program Manager, OCWWS, NWS Headquarters, Silver Spring, Maryland Larry Dunn MIC, WFO Salt Lake City, Utah Jim Purpura MIC, WFO San Diego, California Larry Mooney MIC, WFO Denver/Boulder Colorado viii Acronyms AOML Atlantic Oceanographic and Meteorological Laboratory ASOS Automated Surface Observing System EAS Emergency Alert System EDT Eastern Daylight Time EM Emergency Manager FEMA Federal Emergency Management Agency GFDL Geophysical Fluid Dynamics Laboratory GFS Global Forecast System (numerical forecast model) HAZUS HAZARDS (FEMA loss estimation model)
6 HLS Hurricane Local Statement HRD Hurricane Research Division HURREVAC Hurricane Evacuation software mb Millibar MIC Meteorologist in Charge mph Miles per hour NCEP National Centers for Environmental Prediction NDFD National Digital Forecast Database NHC National Hurricane Center nm Nautical miles NMAO NOAA Marine and Aviation Operations NOAA National Oceanic and Atmospheric Administration NOW Short Term Forecast NWR NOAA Weather Radio All Hazards NWS National Weather Service OCWWS Office of Climate, Water and Weather Services RMW Radius of Maximum Winds ROC Regional Operations Center RFC River Forecast Center RI Rapid Intensification Index SERFC Southeast River Forecast Center SFMR Step Frequency Microwave Radiometer SOO Science and Operations Officer SRH Southern Region Headquarters TPC Tropical Prediction Center VCP Volume Coverage Pattern WCM Warning Coordination Meteorologist WFO Weather Forecast Office WSH National Weather Service Headquarters WSR-88D Weather Service Radar, 1988 Doppler WWA Watch, Warning, Advisory [software] 1 Executive Summary Hurricane Charley was a small but powerful Hurricane .
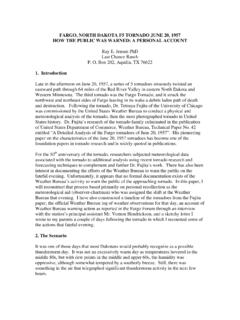
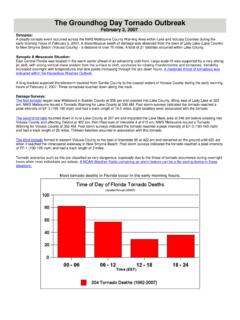
7 It intensified rapidly just before moving onshore near Cayo Costa, Florida on August 13, 2004 as a category 4 Hurricane on the Saffir-Simpson Scale. It is rare for hurricanes to make landfall as a category 4 or 5 and to intensify rapidly just before making landfall. Charley s storm surge (maximum of six to seven feet) was relatively low for a category 4 because the Hurricane force winds were confined to a small area and the storm was moving at 25 mph. However, there were ten direct fatalities in the associated with Charley, and preliminary estimates of the total damage and economic loss were $14 billion. Charley was the third costliest Hurricane in the behind Katrina ( August 2005) and Andrew ( August 1992). The National Hurricane Center (NHC) predicted the center of Hurricane Charley to make landfall near Tampa Bay, Florida as a category 3 Hurricane throughout most of its lifetime. NHC had placed much of Florida s gulf coast under Hurricane watches and warnings approximately 24 to 36 hours before landfall, and they had highlighted the area for possible landfall for four days.
8 However, a slight easterly shift in Charley s track toward the coast south of Tampa less than three hours before landfall caused some coastal residents to feel they had inadequate time to prepare. Media and residents seemed to have focused only on the exact forecasted track of the center of Charley, rather than the cone of uncertainty which NHC had included in these track forecasts. The NWS uses assessment teams to evaluate NWS service during significant hydro-meteorological events to highlight best practices and recommend improvements. Overall, the NWS performed well as indicated by the eighteen best practices identified during this assessment. The WFOs used some creative ideas such as Internet Hurricane safety videos, new volume coverage patterns for the WSR-88D (which detected tornadoes better), and media interviews in Spanish, and they issued enhanced statements and warnings which provided clearer and concise information on Charley s potential for destruction.
9 NOAA s Atlantic Oceanographic Meteorological Laboratory and Hurricane Research Division (AOML/HRD) provided near real time wind analyses to NHC forecasters, researchers, and the Federal Emergency Management Administration s (FEMA) Hazardous model specialists to assist these decision makers. The team also noted some opportunities for improvement. Education on Hurricane products needed improving, particularly with regard to the forecast track cone of uncertainty. The flow and content of information updates during the hours just prior to Hurricane landfall were critical to users and partners. Due either to equipment failures or interruptions in power or communications, disruptions in the availability of real-time observations impacted forecast and warning operations. Information from Step Frequency Microwave Radiometers (SFMR) may have allowed the NHC forecasters to detect the rapid intensification sooner. Finally, some coordination and software problems at the WFOs impacted gridded wind forecasts and the dissemination of some products.
10 The following report contains ten recommendations for addressing these Service Assessment Report Introduction The mission of the tropical cyclone weather services program is to save lives, mitigate property loss, and improve economic efficiency. NOAA accomplishes this by issuing accurate watches, warnings, forecasts, and analyses of hazardous tropical weather, and also by increasing public understanding of these hazards. NOAA s NHC partners with WFOs, FEMA, media outlets, and state and local officials to conduct extensive outreach campaigns and promote Hurricane preparedness. These entities also work very closely when hurricanes and tropical storms make landfall in the to provide timely and accurate information on the associated hazards, potential impacts, and public safety. There were ten direct fatalities in the associated with Charley and insurance companies preliminary estimates of the total damage and economic loss was $14 billion. Charley was the third costliest Hurricane in the behind Katrina ( August 2005) and Andrew ( August 1992).