Transcription of IEEJ Outlook 2018
1 ieej Outlook 2018 ieej 2017 The 427th Forum on Research Wor k ieej Outlook 2018 Prospects and challenges until 2050 Tokyo, 12 October 2017 The Institute of energy Economics, Japan energy , Environment and Economy ieej Outlook 2018 ieej 2017 Overview of the current global energy market 2 Although the trend of Asia as leading the global energy market remains unchanged, developments in the US and China, which accounts for 40% of the energy market, must be carefully monitored. World coal demand dropped for two years in a row (US and China largely) while oil and gas grew. China s coal consumption declined for the third consecutive year (2016, BP). Discussions on Peak Oil (supply) of the 2000s are now changing to Peak Demand. Note the recent movements that aim to ban the sale of internal combustion engine vehicles. CO2 emissions dropped in 2015 but increased again in 2016.
2 India and ASEAN showed big increases despite the declined observed in the US and China. Paris Agreement calls for Long- term low greenhouse gas emission development strategies by 2020. This Outlook expands its estimation period to 2050. ieej Outlook 2018 ieej 2017 scenarios in this Outlook 3 < energy Model Analysis> #Reference Scenario Reflects past trends with current energy and environment policies. Does not reflect any aggressive policies for low-carbon measures. #Advanced Technologies Scenario Assumes the introduction of powerful policies to enhance energy security and address climate change issues. It promotes utmost penetration of low-carbon technologies. #Oil Demand Peak Case Assumes a more rapid introduction of electric drive vehicles than in the reference scenario, to analyze the possibilities of oil demand peak. *1 ZEV: battery electric vehicles, plug-in hybrid electric vehicles and fuel cell battery vehicles *2 CCT: ultra super critical, advanced-USC and integrated coal gasification combined cycle Examples for Technology <Climate Model Analysis> #Reference: Emissions path with continuing past trends #Minimizing Cost: Emissions path with minimizing total cost #Halving Emissions by 2050.
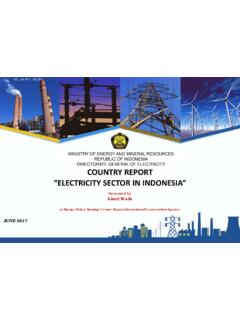
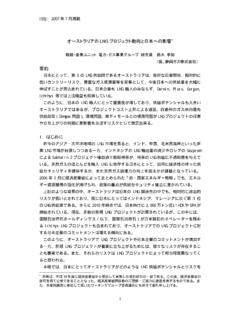
3 Emissions path reflected in AR5 by IPCC Reference Advanced Technologies Peak Oil Demand energy efficiency Vehicle technology (ZEV*1 sales share) 9% in 2030 20 in 2050 21 43 30 100 Coal- fired power generation (CCT*2 share in newly installed capacity) 30 in 2030 90 in 2050 70 100 Same as Reference Carbon free technology Installed capacity Solar PV Wind Nuclear (2015 to 2050) to TW to TW to TW ( 2050) TW TW TW Thermal power generation with CCS (Only countries and regions with CO2 storage potential excluding aquifers) none Newly installed after 2030 ieej Outlook 2018 ieej 2017 energy Outlook up to 2050 ieej Outlook 2018 ieej 2017 0501001502002501990200020102020203020402 050Y2015=100-250250750 ChinaIndiaASEANO ther Asia*MENA**SS AfricaLatin AmericaEuropeIntl. bunkersOECDNon-OECD2015-20302030-2050 MtoeEnergy market shifting to southern Asia Despite large improvements in energy efficiency/intensity, global energy demand continues to increase.
4 Two thirds of the energy growth comes from non-OECD Asia. As China peaks during the 2040s, the center of gravity of the market shifts within Asia towards the south. 5 Global Population, GDP and energy Growth in Primary energy 255 145 132 GDP energy Population <Reference> * Middle East and North Africa, **Sub- Saharan Africa ieej Outlook 2018 ieej 2017 Demand led by fuels for Generation & Transport Three quarters of the growth until 2050 are for fuels for power generation and transportation. The economic development and improvements in living standards of the relatively poor and populous areas non-OECD Asia contribute to the global energy expansion. 6 Electricity Oil fuels for vehicles <Reference> AsiaOtherNon-OECDOECDPWhMWh/pGrowth in 2015-2050 Electricity demand per AsiaOtherNon-OECDOECDMb/dunit/pGrowth in 2015-2050 Vehicleownership per capitaIEEJ Outlook 2018 ieej 2017 5 10 15 20 5 CoalOilNatural GasNuclearRenewablesAsia*RoW**GtoeHigh dependence on fossil fuels continues Sixty percent of the growth in electricity demand will be met by thermal power generation, especially natural gas.
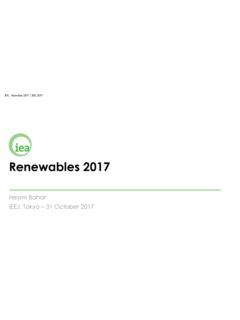
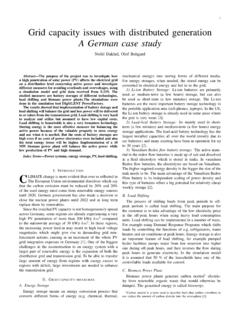
5 Asia leads the large global increase in fossil fuels required for power generation as well as for transportation. The high dependence on fossil fuels remains unchanged and energy related CO2 emissions increase by 34% by 2050. 7 Growth in Primary energy energy - related CO2 <Reference> energy Mix * Non-OECD Asia, **Rest of the world 81% 79% ieej Outlook 2018 ieej 2017 fuelsother fuelsother fuelsgenera-tion losstransmissionlosses* another path Advanced Technologies Scenario With the maximum installation of low-carbon technologies, the Advanced Technologies Scenario can reduce energy consumption by 13% in 2050. energy efficiency in power supply/demand technologies would account for 30% of the total reduction. The energy conservation in the transport sector is quite large due introduction of HEVs, EVs, etc. 8 Global Primary energy Reduction Effects by ATS in 2050 Up-to-date Technologies Efficiency Improvement Efficiency Improvement and Zer o-emission Generation * Including station service power Cumulative Reduction 40 Gt <Advanced Technologies> Efficiency Improvement ieej Outlook 2018 ieej 2017 0 10 20 30 40 50 ReferenceATS20152050 PWh10%28%47%0 2 4 6 8 10 12 14 ReferenceATS20152050 VRE*Other REHydroNuclearGasOilCoalTWZero- emission Generation occupies two thirds ATS slows the growth in electricity demand from times in the reference, down to times.
6 In ATS, non-fossil power generation accounts for 60% and zero- emission generation, including thermal generation with CCS represents two thirds (that s half today s CO2 emissions per unit of generation). Half of the total power capacity will be comprised of intermittent renewable energy , which needs to further reduce costs and enhance grid stability. 9 Global Power Generation Global Power Capacity * Variable Renewable energy includes solar PV, CSP, wind and marine. 66% 62% 38% 34% 60% 6% Non-fossil Fossil with CCS Fossil 34% <Advanced Technologies> ieej Outlook 2018 ieej 2017 01234561990200020102020203020402050 GtoeOilCoalNuclearRenewablesGasGenera-ti onGenera-tionGenera-tionGenera-tionTrans -port-2 -1 0 1 CoalOilGasNuclearRenewablesGtoeCoal falls significantly and below renewables In ATS, coal starts to decline from now and is surpassed by renewables around 2040, due mainly to energy efficiency and the elimination of emissions in the power supply/demand sectors.
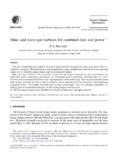
7 Despite large decline in transportation fuels, oil does not reach a peak. Fossil fuels share of the total in 2050 is reduced to 68%, from 79% in the reference case. It is still a high level of dependence. 10 Primary energy Effects by ATS in 2050 (solid line: ATS, dotted line: Reference) <Advanced Technologies> ieej Outlook 2018 ieej 2017 11 CO2 emissions peak in the middle of 2020s energy -related CO2 emissions in ATS decline after 2020s but are still very far from reaching half of current levels by 2050. Efficiency is the most contributor for CO2 reductions from the reference. Two thirds of the total reductions are electricity-related technologies, including non-fossil power, thermal power with CCS and energy efficiency in power supply/demand. energy - related CO2 Emissions Reductions by technology .. Gt .. Gt .. Gt Gt .. Gt .. Gt .. Gt <Advanced Technologies> 44303310203040501990200 02010202 020302040205 0 GtC O2 energy EfficiencyBiofuelsWind, Solar, SwitchingCCSR eferenceATSHalv eIEEJ Outlook 2018 ieej 2017 Ultra-long-term Climate Analysis ieej Outlook 2018 ieej 2017 13 Rule for ultra long- term: Reduce the total cost Without measures against climate change, the mitigation cost is small, while the adaptation and damage costs become substantial.
8 Aggressive mitigation measures on the other hand, would reduce the adaptation and damage costs but the mitigation costs would be notably colossal. The climate change issue is a long- term challenge influencing vast areas over many generations. As such, and from a sustainability point of view, the combination (or the mix) of different approaches to reduce the total cost of mitigation, adaptation and damage is important. Mitigation+Adaptation+Damage=Total Cost Illustration of Total Cost for Each Path Mitigation Typical measures are GHG emissions reduction via energy efficiency and non-fossil energy use. Includes reduction of GHG release to the atmosphere via CCS These measures mitigate climate change. Adaptation Temperature rise may cause sea-level rise, agricultural crop drought, disease pandemic, etc. Adaptation includes counter measures such as building banks/reservoir, agricultural research and disease preventive actions.
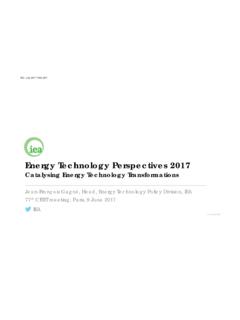
9 Damage If mitigation and adaptation cannot reduce the climate change effects enough to stop sea-level rise, draught and pandemics, damage will take place. Mitigation Cost Adaptation Cost Damage Value Total Cost Mitigation Adaptation Damage Too Small Big Big Reasonable Medium Medium Too Big Small Small Path 1 Path 2 Path 3 ieej Outlook 2018 ieej 2017 Minimizing Total Cost in IAM* *Integrated Assessment Model Total cost of Minimizing Cost is half of the reference. In 2150, GHG emissions decrease by 80% from now and temperature rises by centigrade from the late 19th century. In Halving Emissions by 2050 , temperature peaks at 2100, resulting in C in 2150. However, total cost is 20% higher than the reference and double of the Minimizing Cost path. 14 GHG Emissions GHG Concentrations (incl. aerosol etc.)
10 Temperature Rise (vs. 1850-1900) Total Cost (cumulative present value*) *cumulating 2015 to 2500 *Emissions path reflected RCP in the 5th Assessment Report (AR5) by the Intergovernmental Panel on Climate Change (IPCC). 0204060802000205021002150 GtCO2eqReferenceMinimizing CostHalving Emissions by 2050*02004006008001, C020406080100 MitigationAdaptation&DamageTril. $ ieej Outlook 2018 ieej 2017 -10010203040506020002050210021502200refe rencehigh ECSlow ECSlow ECS C-10010203040506020002050210021502200ref erencehigh discountlow discountlow discount CStill large uncertainties in the climate analysis 15 GHG emissions and temperature rise using different discount rates (minimizing cost) Discount rate This model uses There are a range of to summarized by AR5. Equilibrium Climate Sensitivity (ECS) This model uses 3 degree. According to AR5, high possibility that ECS is between and degree.