Transcription of Influenza Annual Epidemiology Report 2018, NSW
1 SHPN: (HP NSW) 170557 Page | 1 Influenza Annual Epidemiology Report 2018 , NSW This Report describes the surveillance for Influenza and other respiratory pathogens, undertaken by NSW Health to date. This includes data from a range of surveillance systems. For weekly communicable disease surveillance updates refer to the Communicable Disease Weekly Reports at . 1. Annual summary NSW had a mild Influenza season in 2018 which was dominated by the Influenza A(H1N1) strain. The Influenza season commenced in early August, much later than usual, and activity returned to inter-seasonal levels in early October. There was higher than usual Influenza activity in the summer months in January and February and again in December.
2 Emergency department (ED) presentations in the All respiratory illness, fever and unspecified infections category were lower than usual throughout 2018 . There were 17,467 laboratory-confirmed Influenza notifications for the year , well below the record high 103,220 notifications reported in 2017. The peak of Influenza activity based on laboratory testing was during the week ending 9 September when there was an Influenza test positivity rate of %. Influenza A strains accounted for 82% of Influenza notifications, with A(H1N1) strains more common than A(H3N2) strains. Influenza B strains accounted for 18% of notifications, with B/Yamagata lineage strains predominant over B/Victoria lineage strains. There were 12 cases of Influenza with severe complications in children less than 15 years of age in NSW reported to the Australian Paediatric Surveillance Unit (APSU), compared with 56 cases in 2017.
3 Influenza was associated with at least 43 deaths in 2018 , less than 10 percent of the 653 deaths identified in 2017. There were 46 Influenza outbreaks reported in institutions, a dramatic decrease from the 591 outbreaks reported in 2017. Outbreaks were predominantly in residential care facilities and due to Influenza A. Hospital Surveillance Emergency department surveillance NSW emergency department (ED) surveillance for Influenza -like illness (ILI) and other respiratory illnesses is conducted through PHREDSS [1]. The PHREDSS surveillance system uses a statistic [1] NSW Health Public Health Rapid, Emergency Disease and Syndromic Surveillance system. Managed by the Centre for Epidemiology and Evidence, NSW Ministry of Health.
4 Data from 60 NSW emergency departments are included. Comparisons are made with data for the preceding five years. Recent counts are subject to change. This includes data from 59 NSW emergency departments (EDs), representing approximately 85% of metropolitan ED presentations and approximately 60% of rural ED presentations. SHPN: (HP NSW) 170557 Page | 2 called the index of increase to indicate when ILI presentations [2] are increasing at a statistically significant rate. It accumulates the difference between the previous day s count of presentations and the average for that weekday over the previous 12 months. An index of increase value of 15 is considered an important signal for the start of the Influenza season in NSW as it suggests Influenza is circulating widely in the community.
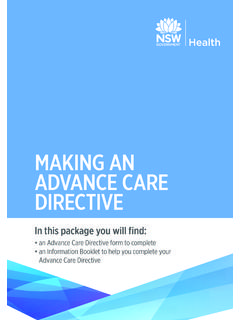
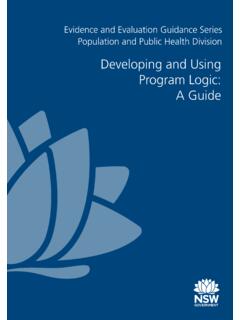
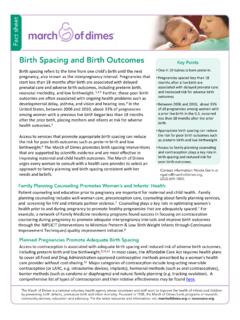
5 From 1 January to 31 December 2018 : Based on the index of increase for ILI, the 2018 PHREDSS ILI season was almost 12 weeks, shorter than the 2017 season of 14 weeks. This year , the PHREDSS seasonal threshold for ILI2 of was exceeded on Monday 16 July, peaked on 10 September at and fell below on 5 October. To 31 October there was a 10% decrease in ED presentations for the all respiratory, fever and unspecified infection syndrome in 2018 (248,262) compared to 2017 (275,826). This syndrome accounted for 13% of unplanned ED presentations in 2018 , compared to 14% in 2017, with a lower winter peak (Figure 1). Presentations in the All respiratory illness, fever and unspecified infections category, which is the best indicator of winter Influenza impact on EDs, were lower than the majority of previous years throughout the winter months (Figure 1).
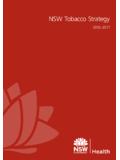
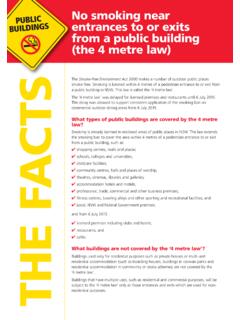
6 However, presentations were higher than the previous five years at the beginning and the end of 2018 . Overall, ILI presentations activity was low and below the previous five years. Only towards the end of 2018 did presentations exceed the five year average (Figure 2). As Influenza can cause exacerbations of other illnesses ( : heart, lung and metabolic diseases), presentations identified as ILI likely represent only a small proportion presentations triggered by Influenza infection. Figure 1: Total weekly counts of ED visits for any respiratory illness, fever and unspecified infections, all ages, January - December, 2018 (black line), compared with the 5 previous years (coloured lines). [2] ILI is when the treating ED doctor makes a provisional clinical diagnosis of ILI Syndrome, which includes: Influenza -like illness or Influenza (including pneumonia with Influenza ).
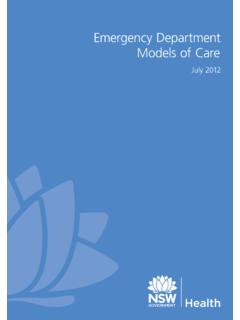
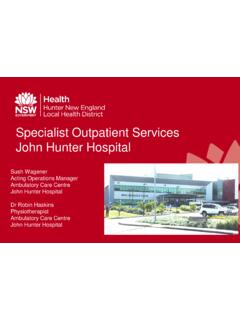
7 SHPN: (HP NSW) 170557 Page | 3 Figure 2: Total weekly counts of ED visits for Influenza -like illness, all ages, January December, 2018 (black line), compared with the 5 previous years (coloured lines). Figure 3 Total weekly counts of ED presentations for pneumonia, from January December 2018 (black line), compared with each of the 5 previous years (coloured lines), for 59 NSW hospitals. Figure 4: Total weekly counts of ED presentations for pneumonia or Influenza -like illness and admitted to a critical care ward, from January December 2018 (black line), compared with each of the 5 previous years (coloured lines), for 59 NSW hospitals. Figure 5: Total weekly counts of ED presentations for bronchiolitis, from January - December 2018 (black line), compared with each of the five previous years (coloured lines), persons of all ages, for 59 NSW hospitals.
8 SHPN: (HP NSW) 170557 Page | 4 APSU Paediatric Surveillance of Influenza with severe complications The Australian Paediatric Surveillance Unit (APSU), based at The Children s Hospital at Westmead, is a national research resource established in 1993 to facilitate active surveillance of uncommon childhood diseases, rare serious complications of common diseases or rare adverse effects of treatment (please refer to the case definition for severe complications). APSU contributors are clinicians working in paediatrics and child health who provide weekly reports on 17 different conditions under surveillance. All positive reports of cases generate a brief questionnaire requesting de-identified information about the child s demographics, details of diagnosis, management and short-term outcome from the clinician.
9 For more details on APSU methods see the APSU website: Since 2009, surveillance for severe complications from Influenza has been conducted by the APSU from July to September. For this reporting period in 2018 there were 12 cases of Influenza with severe complications in children less than 15 years of age in NSW reported to the APSU with the following characteristics: All 12 cases involved infections with Influenza A strains. Ten cases were males and there were three females. The median age of cases was years (range 17 days to years). There were three cases under 6 months of age (25%). Of the nine cases aged 6 months or older (and so old enough to be vaccinated for Influenza ), no cases were known to be vaccinated for Influenza .
10 However, the Influenza vaccination status of 6 (70%) cases was not known. Four (33%) of the cases had an underlying chronic medical condition. Seven (58%) of the cases required intensive care admission during their hospitalisation and there was one death recorded. Three (25%) cases required ongoing treatment post discharge from hospital. The median length of stay in hospital was 8 days (range 1-29 days). Medical complications were recorded for all 12 cases including pneumonia (4 cases), bacterial co-infections, mechanical ventilation (3 cases) and encephalitis (2 cases). Influenza Complications Alert Network (FluCAN) In 2009, a rapid alert system for severe respiratory illness: the FluCAN Surveillance System was created with the involvement and support of the Thoracic Society of Australia and New Zealand and funding from the NH&MRC.