Transcription of Update on COVID-19 in Canada: Epidemiology and Modelling
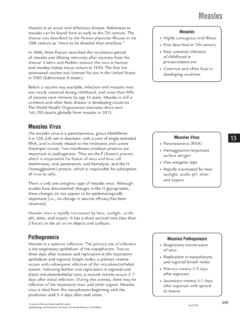
1 Update on COVID-19 in Canada: Epidemiology and Modelling December 10, 2021. Nationally, COVID-19 disease activity is increasing and severity could begin to rise if this trend continues Number (cases/ Daily counts Number (deaths). in hospital / in ICU) (average over past 7 days): 10,000 3,300 cases 900. 1,469 in hospital 9,000 800. 460 in ICU. 8,000 20 deaths 700. 7,000. 600. 6,000. 500. 5,000. 400. 4,000. 300. 3,000. 2,000 200. 1,000 100. 0 0. Mar May Jul Sep Nov Jan Mar May Jul Sep Nov 2020 2021. Cases Hospitalizations ICU Deaths Data as of December 8, 2021. Note: Trend lines reflect 7-day moving averages. Total hospitalizations and ICU admissions include all people in hospital and in ICU on that day. 1. Hospitalizations and ICU counts include data from nine of thirteen Canadian provinces and territories. COVID-19 activity is increasing nationally, primarily driven by epidemic growth in Ontario and Quebec Number cases / in hospital per 100,000 population Date (month year ).
2 Cases Hospitalizations Data as of December 7, 2021. Note: Daily cases trend lines reflect 7-day moving averages. Total number in hospitals include all people in hospital on that day. 2. Canada's Rt has been relatively unstable, but above 1 over the past 5 weeks, indicating the epidemic is in a growth pattern nationally, with considerable regional variation 2 When Rt is consistently >1, the epidemic is growing Rt relatively unstable over the past 5 weeks 1. When Rt is consistently <1, the epidemic is being brought under control 0. Apr Jun Aug Oct Dec Feb Apr Jun Aug Oct Dec 2020 2021. Data as of December 6, 2021. Note: 7-day moving average. 3. Nationally, incidence rates remain highest among children under 12 years of age, with the large majority of people aged 12 years or older now fully vaccinated 40 Incomplete data, due to reporting lag }. 4th wave: highest incidence in 30. Number of cases per 100,000.
3 5-11 year olds (7 day moving average). 20. 10. 0. Jun Aug Oct Dec Feb Apr Jun Aug Oct Dec 2020 2021. 0-4 years 5-11 years 12-19 years 20-39 years 40-59 years 60 years and older Data as of December 7, 2021. Source: Detailed case data submitted to PHAC by the provinces and territories. Shaded area represents period of accumulating data. 4. Date is the earliest of symptom onset date, lab specimen collection date, lab result date, date reported to province or territory, and date reported to PHAC. Outbreaks in school and childcare settings remain small in size and predominantly involve young children, under 12 years of age Incomplete data, due to reporting lag 1,750. }. Number of outbreak-associated cases 1,500. in school/childcare settings 1,250. 1,000. 750. 500. 250. 0. 03 Jan 31 Jan 28 Feb 28 Mar 25 Apr 23 May 20 Jun 18 Jul 15 Aug 12 Sep 10 Oct 07 Nov Week outbreak declared (day month). Data as of December 4, 2021 based on COVID-19 outbreaks and cases in school and childcare settings reported from Ontario and Quebec.
4 5. Delta variant continues to predominate in Canada and globally, while spread of the Omicron variant has increased Omicron ( ) preliminary data suggest: Transmissibility Severity Immunity Potential to spread faster than Not known whether higher Vaccine effectiveness under investigation;. the highly transmissible Delta or lower risk of severe may decrease vaccine protection against illness and death infection, but some level of protection South Africa: cases have risen against severe disease likely to remain much quicker with Omicron Some types of current compared to previous waves treatments may be less May be able to escape immunity from effective prior infection Greater transmissibility or reduced protection from prior Larger numbers of cases Canada/worldwide: cases detected in infection/vaccination could drive could impact healthcare both vaccinated and unvaccinated people resurgence capacity Vaccination, in combination with public health measures and individual protective practices continue to help control COVID-19 spread, including for Omicron and the predominating Delta variant 6.
5 Despite recent detection of the Omicron variant in multiple jurisdictions, Delta continues to predominate in widespread but variable disease activity across Canada Status of Omicron in Canada as of December 9, 2021: * * Omicron case(s). confirmed Cases confirmed in seven jurisdictions Majority linked to international travel or close contact with * * travelers * Some suspected community * * transmission * Asymptomatic or mild Health region level incidence data as of December 7, 2021. Note: Map only shows COVID-19 cases where health region had been attributed in source data. Data sources: COVID-19 Canada Open Data Working Group. Epidemiological Data from the COVID-19 Outbreak in Canada. Statistics Canada. Table 17-10-0134-01 Estimates of population (2016 Census and administrative data), by age group and sex for July 1st, Canada, provinces, territories, 7. health regions ( 2018 boundaries) and peer groups.
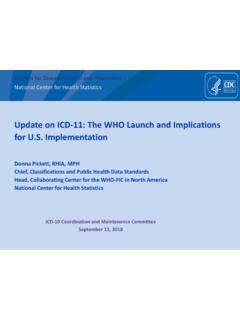
6 95% of Canadians now eligible for COVID-19 vaccines; >81% of the total population have at least one dose and >76% are fully vaccinated as coverage continues to increase Percentage of eligible people ( 5 years) with at least one dose and fully vaccinated by age group, as of December 4th, 2021. 80+ 95% 96%. 70-79 94% 95%. 60-69 92% 93%. 50-59 88% 90%. 40-49 86% 89% 100%. 30-39 82% 86%. 18-29 82% 86%. 12-17 82% 87%. 5-11 1% 17%. 0% 10% 20% 30% 40% 50% 60% 70% 80% 90% 100%. Fully vaccinated At least one dose Data as of December 4, 2021. Note: Data obtained from the Canadian COVID-19 Vaccination Coverage Surveillance System. With the addition of some 11 year olds who turn 12 in 2021 -- and received off-label vaccinations as part of the 12-17 year old program -- the 5 to 11 year age group has already achieved 17% coverage with at least one dose and 8. 1% are fully vaccinated. Fully vaccinated people are at significantly lower risk of being hospitalized with COVID-19 .
7 While COVID-19 vaccines continue to provide excellent protection against severe illness in all age groups, the relative difference in rates between unvaccinated and fully vaccinated people is even greater for youth and younger adults who are at lower overall risk of hospitalization Among youth and adults Among older adults aged 12 to 59 years, aged 60 years or older, unvaccinated people were unvaccinated people were 32 times 16 times more likely to be hospitalized more likely to be hospitalized with COVID-19 than with COVID-19 than fully vaccinated people fully vaccinated people Data as of December 3, 2021 using data from October 26-November 20, 2021 from ten provinces and territories for the population 12 years or older, adjusting for age. Definitions: unvaccinated cases include those who were unvaccinated at the time of their onset; fully vaccinated cases had onset 14 days from their second dose.
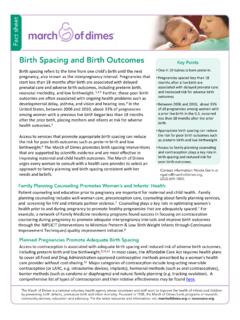
8 9. Resurgence is forecast for Canada and could be further accelerated if Omicron replaces Delta in the coming weeks Reported cases DELTA Predominant If transmission increases by 15%. If we maintain the current levels of transmission If public health measures reduce transmission by 15% today OMICRON Replacement If we maintain the current levels of transmission and Omicron successfully establishes*. 2021 2022. *Underestimate - accounts for only increased transmissibility but not immune evasion Data as of December 6, 2021. Note: Output from PHAC-McMaster model. Model considers impact of vaccination and increased transmissibility of VOCs, 10. refer to annex for detailed assumptions on Modelling . With the possibility of waning protection of vaccines, vaccinating children and providing booster doses to adults could help reduce the impact through 2022. 5-11 vaccination 5-11 vaccination 5-11 vaccination Boosters for 18+ Boosters for 18+ Boosters for 18+.
9 OUTCOME: OUTCOME: OUTCOME: . hospital hospital hospital ! capacity ! capacity may capacity not exceeded be exceeded, exceeded but later Hospital capacity for COVID-19 patients Restrictive closures lifted Vaccination of 5-11 year olds Median hospitalization prevalence Personal physical distancing lifted Booster administration Note: The grey shaded area represents the range of outcomes of model realisations; the black line represents the median value. The shaded blue area represents the vaccination rollout period for children aged 5-11 and the shaded light orange area represents the vaccination rollout period for booster doses. The overall vaccine coverage varies between 79 and 85% depending on the scenario in the total population. The two vertical lines are: lifting of restrictive PH measures (solid blue line, September 1, 2021), lifting of personal physical distancing (solid green line, March 1, 2022).
10 The red dashed horizontal line represents the Canadian hospital bed limit (31 beds per 100,000, updated January 25, 2021 from Health Canada data), this limit assumes 40% of all beds available for COVID-19 patients but will vary across provinces and territories. Includes potential impact of 11. waning immunity. Includes impact of Alpha and Delta, but not Omicron. See annex for detailed assumptions. International experience shows the need for continued vigilance and timely response to emerging risks 1,000. 900. Daily cases per 1,000,000 population 800. 700 United Kingdom Germany 600. 500. 400. United States 300. 200 South Africa 100 Canada 0. Jan Apr Jul Oct Jan Apr Jul Oct 2020 2021. Data as of December 7, 2021. Source: Our World in Data 12. Challenges remain, but with continued vigilance, expansion of vaccination programs, and layers of protection we can celebrate the holidays more safely Canada is Better Protected Despite the challenges ahead, we have more and better protections going with COVID-19 vaccines into this holiday and winter season than previously.