Transcription of International Comparisons: Reading, Mathematics, and ...
1 The Condition of Education 2020 | 1 Chapter: 4/ International Comparisons Section: AssessmentsInternational Comparisons: reading , Mathematics, and Science Literacy of 15-Year-Old StudentsIn 2018, there were 8 education systems with higher average reading literacy scores for 15-year-olds than the United States, 30 with higher mathematics literacy scores, and 11 with higher science literacy Program for International Student Assessment (PISA), coordinated by the Organization for Economic Cooperation and Development (OECD), has measured the performance of 15-year-old students in reading , mathematics, and science literacy every 3 years since 2000. In 2018, PISA was administered in 791 countries and education systems,2 including all 37 member countries of the OECD. PISA 2018 results are reported by average scale score (from 0 to 1,000) as well as by the percentage of students reaching particular proficiency levels. proficiency results are presented in terms of the percentages of students reaching proficiency level 5 and above ( , top performers) and the percentages of students performing below proficiency level 2 ( , low performers).
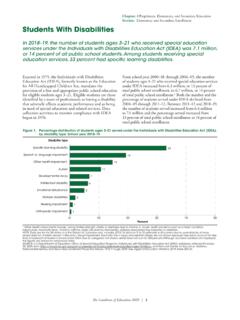
2 proficiency level 2 is considered a baseline of proficiency by the Condition of Education 2020 | 2 Chapter: 4/ International Comparisons Section: AssessmentsInternational Comparisons: reading , Mathematics, and Science Literacy of 15-Year-Old StudentsTable 1. Average scores of 15-year-old students on the Program for International Student Assessment (PISA) reading literacy scale, by education system: 2018 Education systemAverage scoreAverage scoreOECD averageB-S-J-Z (China)1 SingaporeMacau (China)Hong Kong (China)EstoniaCanadaFinlandIrelandKorea, Republic ofPolandSwedenNew ZealandUnited StatesUnited KingdomJapanAustraliaChinese TaipeiDenmarkNorwayGermanySloveniaBelgiu mFrancePortugalCzech RepublicNetherlandsAustriaSwitzerlandCro atiaLatviaRussian FederationItalyHungaryLithuaniaIcelandBe larusIsraelLuxembourg4875555495255245235 2052051851451250650650550450450350350149 9498495493493492490485484484479479479476 476476474474470470 Education systemUkraineTurkey2 Slovak RepublicGreeceChileMaltaSerbiaUnited Arab EmiratesRomania2 UruguayCosta Rica2 CyprusMoldova, Republic ofMontenegro, Republic ofMexico2 Bulgaria2 Jordan2 Malaysia2 Brazil 2 Colombia2 Brunei DarussalamQatarAlbaniaBosnia and HerzegovinaArgentinaPeru2 Saudi ArabiaThailand2 North MacedoniaBaku (Azerbaijan)
3 3 KazakhstanGeorgiaPanama2 IndonesiaMorocco2 LebanonKosovoDominican Republic2 Philippines24664664584574524484394324284 2742642442442142042041941541341240840740 5403402401399393393389387380377371359353 353342340 Average score is higher than average score at the .05 level of statistical significance. Average score is lower than average score at the .05 level of statistical significance. 1 B-S-J-Z (China) refers to the four PISA participating China provinces: Beijing, Shanghai, Jiangsu, and Zhejiang. 2 At least 50 percent but less than 75 percent of the 15-year-old population is covered by the PISA sample. 3 Less than 50 percent of the 15-year-old population is covered by the PISA sample. NOTE: Education systems are ordered by 2018 average score. Scores are reported on a scale from 0 to 1,000. Italics indicate non-OECD countries and education systems. Education systems are marked as OECD countries if they were OECD members in 2018. The OECD average is the average of the national averages of the OECD member countries, with each country weighted equally.
4 In the case of reading literacy, the 2018 OECD average does not include Spain due to issues with its PISA 2018 reading literacy data. Although Spain s PISA 2018 data meet International technical standards, its reading literacy data show unusual student response behavior that prevent them from being reported at this time. Although Vietnam participated in PISA 2018, technical problems with its data prevent results from being discussed in this indicator. SOURCE: Organization for Economic Cooperation and Development (OECD), Program for International Student Assessment (PISA), 2018. See Digest of Education Statistics 2019, table 2018, average reading literacy scores ranged from 340 in the Philippines to 555 in Beijing, Shanghai, Jiangsu, and Zhejiang (B-S-J-Z) (China). The average reading score (505) was higher than the OECD average score (487). Eight education systems had higher average reading scores than did the United States, and 11 education systems had scores that were not measurably different from the Condition of Education 2020 | 3 Chapter: 4/ International Comparisons Section: AssessmentsInternational Comparisons: reading , Mathematics, and Science Literacy of 15-Year-Old StudentsFigure 1.
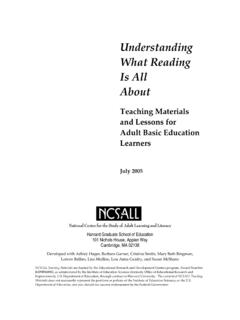
5 Percentage of 15-year-old students performing on the Program for International Student Assessment (PISA) reading literacy scale, by selected proficiency levels and education system: 2018 United Arab EmiratesLatviaLithuaniaMaltaItalyRussian FederationHungaryIcelandPortugalAustriaL uxembourgSloveniaSwitzerlandCzech RepublicDenmarkNetherlandsFranceBelgiumJ apanIsraelChinese TaipeiNorwayGermanyUnited KingdomIrelandPolandAustraliaNew ZealandKorea, Republic ofSwedenUnited StatesMacau (China)EstoniaFinlandHong Kong (China)CanadaB-S-J-Z (China)1 SingaporeOECD average23*11*5*14*13*14*11*11*191815*192 015*12*1721191831*17*212124*16*2124*1829 *24*2026*25*22*23*36*24*22*43*9*26*22*15 151414141413131313121211*11*11*11*10*10* 10*9*9*8*8*8*8*8*7*7*7*6*5*5*5*5*5*5*020 406080100020406080100 Education systemBelowlevel 2 At or abovelevel 5 Education systemBelowlevel 2 At or abovelevel 5 KosovoMorocco2 Philippines2 IndonesiaDominican Republic2 Saudi ArabiaBaku (Azerbaijan)
6 3 Thailand2 Bosnia and HerzegovinaPanama2 GeorgiaJordan2 North MacedoniaAlbaniaKazakhstanMalaysia2 Costa Rica2 ArgentinaLebanonMexico2 Montenegro, Republic ofPeru2 Colombia2 Moldova, Republic ofBrunei DarussalamRomania2 UruguayCyprusBrazil2 Bulgaria2 SerbiaChileQatarTurkey2 UkraineGreeceBelarusSlovak RepublicCroatia2231*23*31*26*26*51*32*38 *47*50*44*42*41*52*43*50*54*44*45*68*52* 42*46*64*52*55*41*64*64*54*60*60*52*79*7 0*81*73*79*5*5*4*4*3*3*3*3*3*2*2*2*2*1*1 *1*1*1*1*1*1*1*1*#!*#*#*#!*#!*#!*#!*#!*# !*#!!*#!!*#!!*#!!*#!!*#!!*#!!*PercentPer cent Below level 2 At or above level 5 # Rounds to zero. ! Interpret data with caution. Estimate is unstable due to high coefficient of variation (> 30 percent and 50 percent). !! Interpret data with caution. Estimate is unstable because the standard error represents more than 50 percent of the estimate. * p < .05. Significantly different from the percentage. 1 B-S-J-Z (China) refers to the four PISA participating China provinces: Beijing, Shanghai, Jiangsu, and Zhejiang.
7 2 At least 50 percent but less than 75 percent of the 15-year-old population is covered by the PISA sample. 3 Less than 50 percent of the 15-year-old population is covered by the PISA sample. NOTE: Education systems are ordered by 2018 percentages of 15-year-olds in levels 5 and above. Descriptions of the skills and knowledge of students at each reading proficiency level are available at To reach a particular proficiency level, a student must correctly answer a majority of items at that level. Students were classified into reading proficiency levels according to their scores. Exact cut scores are as follows: below level 2 is a score less than or equal to ; at or above level 5 is a score equal to or greater than Scores are reported on a scale from 0 to 1,000. Italics indicate non-OECD countries and education systems. Education systems are marked as OECD countries if they were OECD members in 2018. The OECD average is the average of the national percentages of the OECD member countries, with each country weighted equally.
8 In the case of reading literacy, the 2018 OECD average does not include Spain due to issues with its PISA 2018 reading literacy data. Although Spain s PISA 2018 data meet International technical standards, its reading literacy data show unusual student response behavior that prevent them from being reported at this time. Although Vietnam participated in PISA 2018, technical problems with its data prevent results from being discussed in this indicator. SOURCE: Organization for Economic Cooperation and Development (OECD), Program for International Student Assessment (PISA), 2018. See Digest of Education Statistics 2019, table Condition of Education 2020 | 4 Chapter: 4/ International Comparisons Section: AssessmentsInternational Comparisons: reading , Mathematics, and Science Literacy of 15-Year-Old StudentsPISA reports reading literacy in terms of eight proficiency levels, with level 1c being the lowest and level 6 being the highest.
9 Descriptions of the skills and knowledge of students at each reading proficiency level can be found here. Students performing at levels 5 and 6 have mastered the sophisticated reading skills required to interpret and evaluate deeply embedded or abstract text and are considered top performers. The percentage of students who were top performers in reading literacy (14 percent) was larger than the OECD average percentage (9 percent). Percentages of top performers ranged from nearly 0 percent in 16 education systems to 26 percent in Singapore. Two education systems, Singapore and B-S-J-Z (China), had larger percentages of top performers in reading literacy than did the United percentage of students who were low performers in reading literacy (19 percent) was smaller than the OECD average percentage (23 percent). Percentages of low performers ranged from 5 percent in B-S-J-Z (China) to 81 percent in the Philippines. Twelve education systems had smaller percentages of low performers in reading literacy than did the United States.
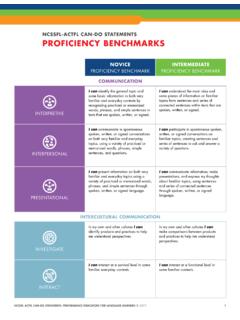
10 The Condition of Education 2020 | 5 Chapter: 4/ International Comparisons Section: AssessmentsInternational Comparisons: reading , Mathematics, and Science Literacy of 15-Year-Old StudentsTable 2. Average scores of 15-year-old students on the Program for International Student Assessment (PISA) mathematics literacy scale, by education system: 2018 Education systemAverage scoreAverage scoreOECD averageB-S-J-Z (China)1 SingaporeMacau (China)Hong Kong (China)Chinese TaipeiJapanKorea, Republic ofEstoniaNetherlandsPolandSwitzerlandCan adaDenmarkSloveniaBelgiumFinlandSwedenUn ited KingdomNorwayGermanyIrelandCzech RepublicAustriaLatviaFranceIcelandNew ZealandPortugalAustraliaRussian FederationItalySlovak RepublicLuxembourgSpainLithuaniaHungaryU nited StatesBelarusMalta4895915695585515315275 2652351951651551250950950850750250250150 0500499499496495495494492491488487486483 481481481478472472 Education systemCroatiaIsraelTurkey2 UkraineGreeceCyprusSerbiaMalaysia2 AlbaniaBulgaria2 United Arab EmiratesBrunei DarussalamRomania2 Montenegro, Republic ofKazakhstanMoldova, Republic ofBaku (Azerbaijan)