Transcription of Introduction to Demand Planning & Forecasting
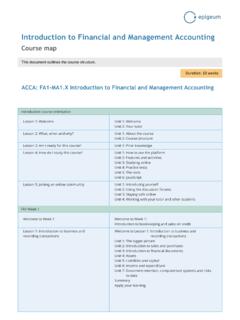
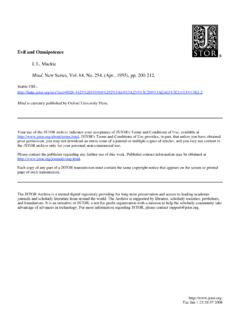
1 MIT Center for Transportation & -Supply Chain & Logistics fundamentals Introduction to Demand Planning & Forecasting - Supply Chain and Logistics fundamentals Lesson: Demand Forecasting Basics Demand Process Three Key Questions Demand Planning n Product & Packaging n Promotions n Pricing n Place 2 What should we do to shape and create Demand for our product? What should we expect Demand to be given the Demand plan in place? How do we prepare for and act on Demand when it materializes? Demand Forecasting n Strategic, Tactical, Operational n Considers internal & external factors n Baseline, unbiased, & unconstrained Demand Management n Balances Demand & supply n Sales & operations Planning (S&OP) n Bridges both sides of a firm Material adapted from Lapide, L.
2 (2006) Course Notes, Logistics Systems. - Supply Chain and Logistics fundamentals Lesson: Demand Forecasting Basics Forecasting Levels 3 Level Horizon Purposes Quarterly Brand Plans Budgeting Sales Planning Manpower Planning Strategic Year/Years Business Planning Capacity Planning Investment Strategies Ta c t i c a l Months/Weeks Short-term Capacity Planning Master Planning Inventory Planning Operational Days/Hours Transportation Planning Production Planning Inventory Deployment Material adapted from Lapide, L.
3 (2006) Course Notes, Logistics Systems. - Supply Chain and Logistics fundamentals Lesson: Demand Forecasting Basics Agenda Forecasting Truisms Subjective vs. Objective Approaches Forecast Quality Forecasting Metrics - Supply Chain and Logistics fundamentals Lesson: Demand Forecasting Basics Forecasting Truisms 1: Forecasts are always wrong 5 - Supply Chain and Logistics fundamentals Lesson: Demand Forecasting Basics 1. Forecasts are always wrong Why? n Demand is essentially a continuous variable n Every estimate has an error band n Forecasts are highly disaggregated w Typically SKU-Location-Time forecasts n Things happen.
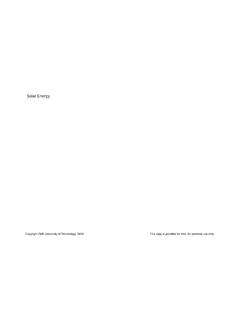
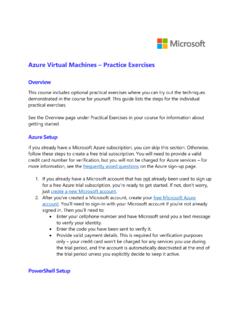
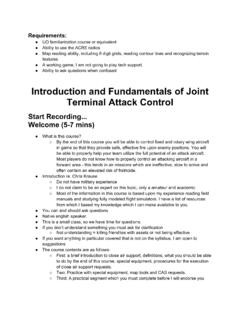
4 OK, so what can we do? n Don t fixate on the point value n Use range forecasts n Capture error of forecasts n Use buffer capacity or stock 6 - Supply Chain and Logistics fundamentals Lesson: Demand Forecasting Basics Forecasting Truisms 2: Aggregated forecasts are more accurate 7 - Supply Chain and Logistics fundamentals Lesson: Demand Forecasting Basics 2. Aggregated forecasts are more accurate 8 Aggregation by SKU, Time, Location, etc. Coefficient of Variation (CV) n Definition: Standard Deviation / Mean = / n Provides a relative measure of volatility or uncertainty n CV is non-negative and higher CV indicates higher volatility - 20 40 60 80 100 120 140 160 180 200 2/26/11 3/28/11 4/27/11 5/27/11 6/26/11 7/26/11 8/25/11 Daily Demand Red: =100, =45, CV= Blue: =100, =1, CV= - Supply Chain and Logistics fundamentals Lesson.
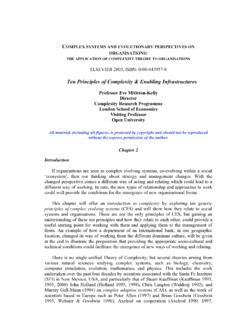
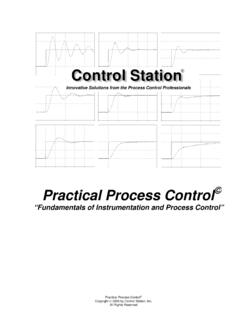
5 Demand Forecasting Basics Aggregating by SKU 9 Coffee Cups and Lids @ the Sandwich Shop n Large ~N(80, 30) CV = n Medium ~N(450, 210) CV = n Small ~N(250, 110) CV = - 100 200 300 400 500 600 700 800 8/14/13 9/13/13 10/13/13 11/12/13 12/12/13 1/11/14 2/10/14 3/12/14 4/11/14 5/11/14 6/10/14 Small Medium Large - Supply Chain and Logistics fundamentals Lesson: Demand Forecasting Basics 10 What if I design cups with a common lid? Common Lid ~N(780, 239) CV = n = (80 + 450 + 250) = 780 units/day n = sqrt(302 + 2102 + 1102) = 239 units/day - 200 400 600 800 1,000 1,200 1,400 1,600 8/14/13 9/13/13 10/13/13 11/12/13 12/12/13 1/11/14 2/10/14 3/12/14 4/11/14 5/11/14 6/10/14 Aggregating by SKU Example of Modularity or Parts Commonality Reduces the relative variability Increases Forecasting accuracy Lowers safety stock requirements Large ~N(80, 30) CV= Med.
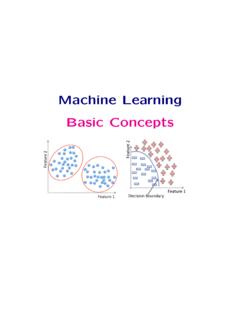
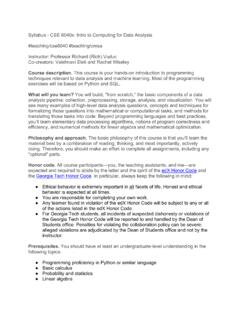
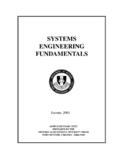
6 ~N(450, 210) CV= Small ~N(250, 110) CV= Lids ~N(780, 239) CV= - Supply Chain and Logistics fundamentals Lesson: Demand Forecasting Basics 11 Aggregating by Time - 400 800 1,200 1,600 8/14/13 9/13/13 10/13/13 11/12/13 12/12/13 1/11/14 2/10/14 3/12/14 4/11/14 5/11/14 6/10/14 Daily Demand for Lids ~N(780, 239) CV= - 2,000 4,000 6,000 8,000 1 5 9 13 17 21 25 29 33 37 41 45 49 Weekly Demand for Lids ~N(5458, 632) CV= - 5,000 10,000 15,000 20,000 25,000 30,000 1 2 3 4 5 6 7 8 9 10 11 12 Monthly Demand for Lids ~N(21840, 1264)
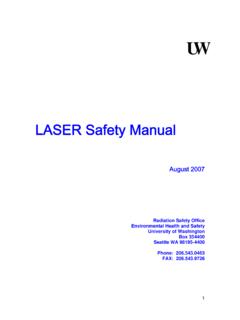
7 CV= Forecasts with longer time buckets have better forecast accuracy. The time bucket used should match the situation. - Supply Chain and Logistics fundamentals Lesson: Demand Forecasting Basics Aggregating by Locations Suppose we have three sandwich shops n Weekly lid Demand at each ~N(5458, 632) CV= 12 What if Demand is pooled at a common Distribution Center? n Weekly lid Demand at DC ~N(16374, 1095) CV= ~N(5458, 632) ~N(5458, 632) ~N(5458, 632) CV reduces as we aggregate over SKUs, time, or locations.
8 ~N(16374, 1095) CVind= CVagg= n n= n= - Supply Chain and Logistics fundamentals Lesson: Demand Forecasting Basics Forecasting Truisms 3: Shorter horizon forecasts are more accurate 13 - Supply Chain and Logistics fundamentals Lesson: Demand Forecasting Basics 14 3. Shorter horizon forecasts are more accurate 12 11 10 9 8 7 6 5 4 3 2 1 24 23 22 21 ???? - Supply Chain and Logistics fundamentals Lesson: Demand Forecasting Basics 15 3. Shorter horizon forecasts are more accurate 12 11 10 9 8 7 6 5 4 3 2 1 24 23 22 21 ?
9 Postponed final customization to closer time of consumption Risk pooling of component ( , ham) increases forecast accuracy. - Supply Chain and Logistics fundamentals Lesson: Demand Forecasting Basics Forecasting Truisms Forecasts are always wrong Use ranges & track forecast error Aggregated forecasts are more accurate Risk pooling reduces CV Shorter time horizon forecasts are more accurate Postpone customization until as late as possible 16 - Supply Chain and Logistics fundamentals Lesson: Demand Forecasting Basics Subjective & Objective Approaches 17 - Supply Chain and Logistics fundamentals Lesson.
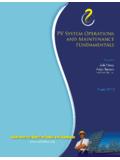
10 Demand Forecasting Basics Fundamental Forecasting Approaches Judgmental n Sales force surveys n Jury of experts n Delphi techniques Experimental n Customer surveys n Focus group sessions n Te s t m a r ke t i n g Causal / Relational n Econometric Models n Leading Indicators n Input-Output Models Time Series n Black Box Approach n Past predicts the future n Identify patterns Often times, you will need to use a combination of approaches Subjective Objective - Supply Chain and Logistics fundamentals Lesson: Demand Forecasting Basics Forecasting Quality 19 - Supply Chain and Logistics fundamentals Lesson: Demand Forecasting Basics Cost of Forecasting vs Inaccuracy Cost of Forecasting Forecast Accuracy Cost Cost of Errors In Forecast Total Cost Overly Na ve Models Excessive Causal Models Good Region - Supply Chain and Logistics fundamentals Lesson.