Transcription of Introduction to Map Design - Esri
1 1996 Environmental Systems Research Institute, Map DesignIntroductionThis document is intended to help people without formal training in map Design learn toproduce maps for publication or electronic display using ArcView, a desktopgeographic information system (GIS). A GIS is a system for the display, analysis,storage and retrieval of information about places on the earth. GIS is a useful tool forexploring information and communicating your discoveries to others using maps andother graphic can be used either as a research tool, where maps are intermediate steps in ananalysis, or as a map production tool, where publication-ready maps are the endproduct. In either case, knowing something about the basic principles of map making(cartography) will help you use GIS more GIS is part of the analysis process, the maps will be changing constantly, andthe Design of any one map depends on the overall Design of the project.
2 It may not benecessary to create an elaborate layout for each map, because some maps may betemporary - useful only as intermediate steps in the analysis GIS is used as a map production tool, however, it is important to make each mapas informative as possible. The map user and the map designer probably will bedifferent people, and the map user is not necessarily familiar with the information in theGIS - the data behind the maps. Cartography is both an art and science. This document is not a paint-by-numbers setof rules, but rather a guide to some of the general principles that cartographers haverefined over many years. Remember, however, that creative control ultimately restswith to Map Design , page 2 1996 Environmental Systems Research Institute, of MapsThere are two general types of maps.
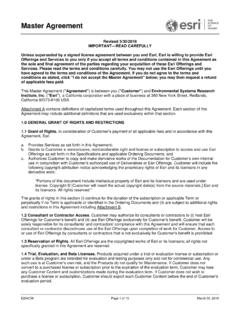
3 Maps that give general information about thelocation of features are reference maps. Maps in a road atlas are an example ofreference maps, as are topographic maps. Those that show the distribution of a specifictopic are thematic or statistical maps. A map showing population distribution bycounty is a thematic MapThematic MapAlthough both reference and thematic maps can be constructed from the data containedin a GIS, this document will focus on thematic maps. Thematic mapping involvessome activities that aren t necessary for reference maps. However, most of theinformation concerning good map Design applies equally well to reference Mapping ConceptsAll maps are representations.
4 It is not possible to show features at their actual size noris it possible to show full detail. A map is a model of the earth at a reduced maps, such as diagrams of chromosomes or atoms, are at an enlarged scale, butgenerally, maps are smaller than the things they represent. Because features cannot beshown at their true size, they must be generalized. Some details are omitted to makethe most important characteristics of a feature more apparent. In addition, three-dimensional objects have been flattened for a two-dimensional display. The transfer offeatures from three dimensions to two involves the use of a map you look at a map, you don t see real features like buildings or people; you seesymbols that represent these things.
5 These symbols should be easily understood bythe map reader. If they are not, the map will not communicate its message. Guidelinesexist to help you use symbols effectively, but they are not absolute laws, like one mightIntro. to Map Design , page 3 1996 Environmental Systems Research Institute, in physics. There is also room for artistic expression - an attractive map will catchthe eye more easily than a dull now, the map you see on the screen or page might look quite different than thethings you see in the real world. Is it still an accurate view of reality? Map accuracy isdifficult to assess. All maps show a selective view of reality, so rather than ask Is themap accurate?
6 It might be better to ask Is the map appropriate for my purposes? Once all the decisions about data, classification and symbols have been made, you llwant to create a map composition that includes the map, a title, a legend, a scale andany other information needed for a complete presentation of your you can see, designing a good map involves more than choosing colors andtypestyles. Fortunately, a geographic information system such as ArcView makes iteasy to see the effects of your map Design decisions quickly and to try severalalternatives before committing to a final ScaleMaps are scale models of the earth. Real world objects have been reduced by aconstant amount, and the map scale tells us the amount of reduction (or enlargement).
7 A map scale is a ratio, where one unit on the map represents many times that value inthe real world. Thus, if a map scale is 1:100 , one inch on the map represents 100inches in the real world. The unit of measurement is not important; one could just aseasily say one foot on the map represents 100 feet on the ground; the ratio remainsconstant. However, you should be careful not to mix units ( , one inch represents100 feet).Representing scaleA map scale can be representedgraphically as well as verbally. Youprobably have seen a scale bar on ahighway map - a line with distances marked off, often in both miles and people find graphic scales easier to use than verbal scales. For example, a oneinch line labeled 1 mile might be easier to interpret than the equivalent ratio, 1:63, addition, a graphic scale remains true even if a map is reduced or enlarged byphotocopying or other means of you had a map at this scale - 1 inch to the mile (63,360 inches), and you needto reduce it to 80% of its original size.
8 When you reduce the map, a graphic scale willbe reduced by the same proportion and will still be accurate. A verbal scale, however,will be in error by 25%. One inch on the map now will represent 79,200 inches ( ), not 63,360 inches. It is probably safest to use a graphic scale, because youcan t always control how others will use your to Map Design , page 4 1996 Environmental Systems Research Institute, ScaleMaps often are referred to as being large scale or small scale . Oddly enough, alarge scale map shows more detail than a small scale map, which confuses manypeople. If you think of scale in terms of fractions, however, this makes sense. Thefraction 1/10,000 is larger than 1/25,000,000.
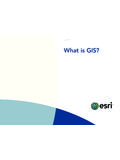
9 Thus, a map at 1:10,000 would belarger scale than a map at 1:25,000,000. There are no rules about what is consideredlarge scale or small scale, but generally, 1:24,000 and larger is large scale and1:250,000 and smaller is small following maps provide examples of large scale and small scale maps. The map onthe left is at a scale of approximately 1:24,000, and shows a small portion ofdowntown Denver. The map on the right is at a scale of approximately 1:50,000,000,and shows western Europe. Large ScaleSmall ScaleSelecting a scale for your mapOur discussion of map scale up to this point has focused on the map , scale is also important in the selection of data sources, which occurs early inthe map-making process.
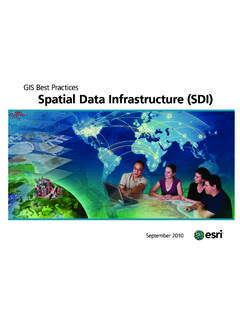
10 Every data set is designed for display at a particular scale (orwithin a range of scales). For example, a 1:500,000 data set will look right whendisplayed at that scale, but will look too sketchy if displayed at 1:50,000. If displayedat 1:5,000,000, it will look too busy or crowded and will take too long to are two maps of the same area; eastern Missouri, where the Missouri River flowsinto the Mississippi River north of St. Louis. The map on the left is drawn from1:2,000,000 scale data; the map on the right, from 1:25,000,000 scale data. Notice thatIntro. to Map Design , page 5 1996 Environmental Systems Research Institute, maps show the same general features, but give you very different 1:2,000,000 scale data are much more detailed.