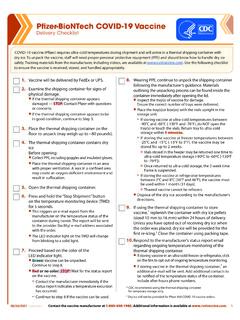
Transcription of IRON ORE1 - USGS
1 Prepared by Christopher Candice Tuck [(703) 648 4912, IRON ORE1 (Data in thousand metric tons, usable ore, unless otherwise noted) Domestic Production and Use: In 2020, mines in Michigan and Minnesota shipped 98% of the usable iron ore products, which were consumed in the steel industry in the United States with an estimated value of $ billion, a decrease from $ billion in 2019. The remaining 2% of domestic iron ore was produced for nonsteel end uses. Seven open pit iron ore mines (each with associated concentration and pelletizing plants), and three iron metallic plants one direct-reduced iron (DRI) plant in Louisiana and two hot-briquetted iron (HBI) plants in Indiana and Texas operated during the year to supply steelmaking raw materials.]
2 The United States was estimated to have produced and consumed of the world s iron ore output. Salient Statistics United States:2 2016 2017 2018 2019 2020e Production: Iron ore 41,800 47,900 49,500 46,900 37,000 Iron metallics 2,070 3,250 3,560 3,660 3,400 Shipments 46,600 46,900 50,400 47,000 34,000 Imports for consumption 3,010 3,720 3,810 3,980 2,900 Exports 8,710 10,600 12,700 11,400 10,000 Consumption: Reported 34,500 34,400 36,600 34,800 27,000 Apparent3 37,900 40,100 41,400 39,100 33,000 Price, average value reported by mines, dollars per ton Stocks, mine, dock, and consuming plant, excluding byproduct ore, yearend 2,990 3,930 3,100 3,500 1,100 Employment, mine, concentrating and pelletizing plant, number 4,660 4,630 4,860 4,960 4,700 Net import reliance4 as a percentage of apparent consumption (iron content of ore) E E E E E Recycling: None.
3 See Iron and Steel Scrap. Import Sources (2016 19): Brazil, 58%; Canada, 21%; Sweden, 7%, Chile, 4%; and other, 10%. Tariff: Item Number Normal Trade Relations 12 31 20 Iron ores and concentrates: Concentrates Free. Coarse ores Free. Other ores Free. Pellets Free. Briquettes Free. Sinter Free. Roasted iron pyrites Free. Depletion Allowance: 15% (domestic), 14% (foreign). Government Stockpile: None. Events, Trends, and Issues: Significant decreases in production, shipments, and trade in 2020 were due to the ongoing effects of the COVID-19 pandemic, which lowered steel production and consumption globally. Domestic iron ore production was estimated to be 37 million tons in 2020, 21% lower than million tons in 2019, owing to the closure of multiple iron ore plants.
4 Total raw steel production was estimated to have decreased to 69 million tons in 2020 from million tons in 2019. The share of steel produced by basic oxygen furnaces, the process that uses iron ore, continued to decline from in 2015 to an estimated 30% in 2020 owing to increased use of electric arc furnaces because of their energy efficiency, reduced environmental impacts, and the ready supply of scrap. Overall, global prices trended upwards to an average value of $ per ton in the first 8 months of 2020, a 4% increase from the 2019 annual average of $ per ton and a 40% increase from the 2018 annual average of $ per ton. Based on reported prices for iron ore fines (62% iron content) imported into China (cost and freight into Tianjin Port), the highest monthly average price during the first 8 months of 2020 was $ per ton in August compared with the high of $ per ton in July 2019.
5 The lowest monthly average price during the same period in Geological Survey, Mineral Commodity Summaries, January 2021 IRON ORE 2020 was $ per ton in April compared with the low of $ per ton in January 2019. The prices trended upwards owing to a reduced supply of higher grade iron ore products, spurred partially by closures of pelletizing plants in Brazil. One company in Brazil cut guidance for pellet sales in 2020 by 25 million to 30 million tons based on first-quarter projections following 302 million tons of iron ore production in 2019, a decrease from 385 million tons produced in 2018, owing to a tailings dam collapse that idled operations at the collocated mine. In August, one company expected to begin production at a hot-briquetted iron plant under construction in Ohio in late 2020, and announced it had entered into a definitive agreement to purchase two iron ore mines, six steelmaking facilities, eight finishing facilities, and three coal and cokemaking operations from another domestic iron and steel production company.
6 In the first half of 2020, five domestic iron ore mines were idled with only four restarting in the second half of the year. One mine continued to remain idle with no plans to restart as of October. Globally, iron ore production in 2020 was expected to decrease slightly from that of 2019. Global finished steel consumption was forecast by the World Steel Association5 to decrease by in 2020 and increase by in 2021. World Mine Production and Reserves: Reserves for Australia, Brazil, and South Africa were revised based on Government and industry sources. Mine production Usable ore Iron content Reserves6, 7 2019 2020e 2019 2020e Crude ore Iron content United States 46,900 37,000 29,800 24,000 3,000 1,000 Australia 919,000 900,000 569,000 560,000 850,000 824,000 Brazil 405,000 400,000 258,000 252,000 34,000 15,000 Canada 58,500 57,000 35,200 34,000 6,000 2,300 Chile 13,100 13,000 8,430 8,000 NA NA China 351,000 340,000 219,000 210,000 20,000 6,900 India 238,000 230,000 148,000 140,000 5,500 3,400 Iran 33,100 32,000 21,700 21,000 2,700 1,500 Kazakhstan 22,000 21,000 6,150 5,900 2,500 900 Peru 15,100 15,000 10,100 10,000 NA 1,500 Russia 97,500 95,000 64,300 63,000 25,000 14,000 South Africa 72,400 71,000 41.
7 200 40,000 1,000 640 Sweden 35,700 35,000 22,100 22,000 1,300 600 Turkey 16,400 16,000 9,110 8,900 NA NA Ukraine 63,200 62,000 39,500 39,000 96,500 92,300 Other countries 67,700 75,000 39,000 43,000 18,000 9,500 World total (rounded) 2,450,000 2,400,000 1,520,000 1,500,000 180,000 84,000 World Resources:6 resources are estimated to be 110 billion tons of iron ore containing about 27 billion tons of iron. resources are mainly low-grade taconite-type ores from the Lake Superior district that require beneficiation and agglomeration prior to commercial use. World resources are estimated to be greater than 800 billion tons of crude ore containing more than 230 billion tons of iron.
8 Substitutes: The only source of primary iron is iron ore, used directly as direct-shipping ore or converted to briquettes, concentrates, DRI, iron nuggets, pellets, or sinter. DRI, iron nuggets, and scrap are extensively used for steelmaking in electric arc furnaces and in iron and steel foundries. Technological advancements have been made, which allow hematite to be recovered from tailings basins and pelletized. eEstimated. E Net exporter. NA Not available. 1 Data are for iron ore used as a raw material in steelmaking unless otherwise noted. See also Iron and Steel and Iron and Steel Scrap. 2 Except where noted, salient statistics are for all forms of iron ore used in steelmaking, and do not include iron metallics, which include DRI, hot-briquetted iron, and iron nuggets.
9 3 Defined as production + imports exports + adjustments for industry stock changes. 4 Defined as imports exports + adjustments for industry stock changes. 5 World Steel Association, 2020, Short range outlook October 2020: Brussels, Belgium, World Steel Association press release, October 15, 7 p. 6 See Appendix C for resource and reserve definitions and information concerning data sources. 7 Million metric tons. 8 For Australia, Joint Ore Reserves Committee-compliant reserves were 23 billion tons for crude ore and 11 billion tons for iron content. 9 For Ukraine, reserves consist of the A and B categories of the Soviet reserves classification system.