Transcription of Jobless Rate’s Waning Influence on Inflation and the Fed
1 WEEKLY MARKET OUTLOOK AUGUST 17, 2017 CAPITAL MARKETS RESEARCH Moody s Analytics markets and distributes all Moody s Capital Markets Research, Inc. materials. Moody s Capital Markets Research, Inc is a subsidiary of Moody s Corporation. Moody s Analytics does not provide investment advisory services or products. For further detail, please see the last page. Jobless Rate s Waning Influence on Inflation and the Fed Credit Markets Review and Outlook by John Lonski Jobless Rate s Waning Influence on Inflation and the Fed.
2 FULL STORY PAGE 2 The Week Ahead We preview economic reports and forecasts from the US, UK/Europe, and Asia/Pacific regions. FULL STORY PAGE 4 The Long View Check our chart here for forecast summaries of key credit market metrics. Full updated stories, The average high-yield EDF metric recently closed at the highest finish since November 17, 2016 s , when the high-yield spread was at 501 bp, begin on page 13. FULL STORY PAGE 13 Ratings Round-Up by Njundu Sanneh Strength in Corporate Credit Markets. FULL STORY PAGE 18 Market Data Credit spreads, CDS movers, issuance.
3 FULL STORY PAGE 20 Moody s Capital Markets Research recent publications Links to commentaries on: Spreads, Saudi Arabia, lending, El Salvador, liquidity, CreditEdge, European credit, rates, sov risk, Qatar, equities, debt-to -GDP, e nergy, bond yields, Philippines, thin spreads, Qatar, toxic tightening, Paris, sales and profits, aging upturn. FULL STORY PAGE 24 Credit Spreads Investment Grade: Year-end 2017 spread to exceed its recent 112 bp. High Yield: After recent spread of 399 bp, it may approximate 450 bp by year-end 2017.
4 Defaults US HY default rate: Compared to June 2017 s , Moody's Credit Policy Group forecasts the US trailing 12-month high-yield default rate will average during 2018 s second quarter. Issuance In 2016, US$-IG bond issuance grew by to a record $ trillion, while US$-priced high-yield bond issuance fell by to $341 billion. For 2017, US$-denominated IG bond issuance may rise by to a new zenith of $ trillion, while US$-priced high-yield bond issuance may increase by to $425 billion, which lags 2014 s $435 billion record high.
5 Click here for Moody s Credit Outlook, our sister publication containing Moody s rating agency analysis of recent news events, summaries of recent rating changes, and summaries of recent research. Moody s Capital Markets Research Weekly Market Outlook Contributors: John Lonski Njundu Sanneh Franklin Kim Yuki Choi Moody's Analytics/Europe: Tomas Holinka +420 ( 221) 666-384 Barbara Teixeira Araujo +420 (224) 106-438 Moody's Analytics/Asia-Pacific: Alaistair Chan +61 (2) 9270-8148 Katrina Ell +61 (2) 9270-8144 Editor Dana Gordon CAPITAL MARKETS RESEARCH 2 AUGUST 17, 2017 CAPITAL MARKETS RESEARCH / MARKET OUTLOOK / Credit Markets Review and Outlook Credit Markets Review and Outlook By John Lonski, Chief Economist, Moody s Capital Markets Research, Inc.
6 Jobless Rate s Waning Influence on Inflation and the Fed The minutes of the July 25-26 meeting of the FOMC indicated that Fed policymakers have become increasingly concerned about persistently soft consumer prices despite higher rates of resource utilization, including the lowest unemployment rate in 16 years. In response, fed funds futures recently assigned only a likelihood to a year-end 2017 midpoint for the fed funds rate that is higher than its current Policymakers and some market participants worry that if underlying Inflation slows when rates of resource utilization climb, then a destructive bout of price deflation might arrive once resource utilization rates inevitably ease.
7 Ordinarily, price Inflation accelerates following a decline by the unemployment rate. However, despite a plunge by the unemployment rate s moving three-month average from July 2012 s to July 2017 s , the average annual rate of core PCE price index Inflation also ebbed from to In all likelihood, this is the slackest and most non-inflationary Jobless rate in history. The unemployment rate s moving three-month average last fell to for the span-ended February 1999. However, the yearly increase by the average hourly wage of the three-months-ended July 2017 was noticeably slower than the of the three-months-ended February 1999.
8 Partly because of faster wage growth, the Jobless rate of early 1999 packed a lot more punch for consumer spending according to wage & salary income s annual advance of the three-months-ended February 1999 compared to its much slower prospective yearly rise of May-July 2017. Other measures of labor market utilization dispute the meaning of a Jobless rate The faster wage growth of the span-ended February 1999 can be partly explained by the then higher labor force participation rate of versus the of the three-months-ended July 2017.
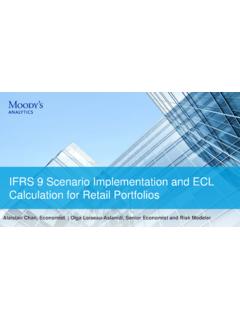
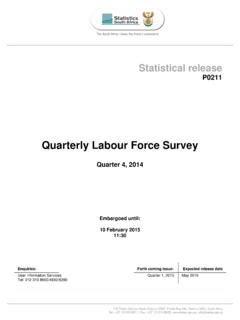
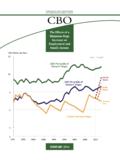
9 Also, jobs approximated a greater of the working-age population during the span-end February 1999 compared to the of May-July 2017. The still relatively low readings for both the labor force participation rate and the ratio of payrolls to the working-age population imply that July s unemployment rate overstates the tightness of the US labor market. In fact, from a purely statistical perspective, both the ratio of payrolls to the working-age population and the ratio s rise over the last three months have been consistent with a a year-end 2017 midpoint for the unemployment rate.
10 (Figure 1.) Rate: % ( L )% of Working-Age Population Not Working ( R )Figure 1: Comparatively High Percentage of the Working-Age Population Not WorkingSuggest Unemployment Rate Overstates Labor Market Tightness moving3-month averages CAPITAL MARKETS RESEARCH 3 AUGUST 17, 2017 CAPITAL MARKETS RESEARCH / MARKET OUTLOOK / Credit Markets Review and Outlook Oddly enough and with important implications for those fretting over the possibility of resurgent price Inflation , the core PCE price index rose by only annually during the three-months-ended February 1999.