Transcription of 世界の風力発電市場 について - jwpa.jp
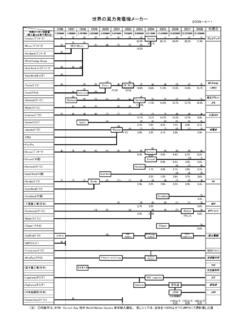
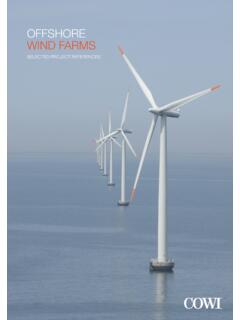
1 Westermeer Siemens 3MW x 48 = 144MW 2016 6 JETRO 2017 12 8 2016 473GW 33 4 8700 kW 2 9200 kW 2016 3 5500 kW 4% GWEC Global Wind Report 201622006 74GW2011 238GW2016 487GW5 26% 5 15% 10 +22%/ 2016 14% 2010 2001 24GW5 25% PTC Gansu Wind Farm kW 2017 8 10 Forbes Wikipedia 4 Copyright 2014 Japan Wind Energy Association Gansu Wind Farm 2009 2020 20GW Alta Wind Energy Center2010 Vestas 600 Wind Catcher project2020 2GW 800 2017 80MW 2MW 40 1/100 1/20 London Array2012 630MW 175 Hornsea1 Siemens7MW 174 Hornsea2 2020 36 Copyright 2014 Japan Wind Energy Association 7 Copyright 2014 Japan Wind Energy Association 1 - 180 2014 158 5
2 167 6 10 8 Copyright 2014 Japan Wind Energy Association ORC Catapult Samsung7MW 1 Adwen Gamesa&Areva AD 8-180 8MW 180m 2 Samsung 7MW 171m CSIC Haizhuang Wind Power ( ) H171-5MW 4 81mEuros MHI Sea Angel 7MW 167m 5 80mVestasV164 8MW 164m AD180 LM 9,500 kW 2017 5 17 Burbo Bank 8MW 32 258MW kW kW Moray 100 950MW 40 / W ( )(2011): ( ).
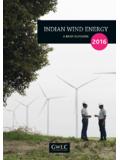
3 80pp. Musial,W. and (2010):Large-Scale Offshore Wind Power in the United StatesAssessment of Opportunities and , ( 500m 3D 1MW 60m 2MW 80m1MW 4 2MW 3 . Total Cost 60m 80m +6% +19% 12136 7 GWEC Global Wind Report 20162016 7 9 2004 8 16 World Market Update2004, BTM Consult ApS 25% 25% 11% 5% 4% 3% 3% 3% 3% 2% 16%2004 35% 17% 14% 6% 6% 3% 2%[ ][ ])
4 2% 2% 11%2004 MW/ 1 2064 2054 875 389 357 274 253 230 199 198 1261 815412 138 MW1 16649 8263 6750 3083 3000 1261 1081 991 889 769 5175 4791116 386 ) CO2 Free ) 15 20 1990 21 2000 2000 2010 16 GW % 94 % 82 % % 75 % % 61 % % 43 % % 40 % %
5 34 % % 15 % % 12 % % 9 % % -68 % % -84 % %17024681012141618-100-80-60-40-20020406 080100 2014 IEA % EU 1 3GW/ 21 20% Wind in power 2016 European statistics WindEurope 10 30 / 19EU 2016 4% EU 3 20% 9 10% 10% Wind in Power 2016 European statistics WindEurope,2017 2 5%10%20% 0%10%20%30%40%50%60%70%80%90%100%1996199 7199819992000200120022003200420052006200 720082009201020112012201320142015 2002 1998 9% 53% 16% 22% 21 Navigant/BTM.
6 World Market Update 1997-2015 0100200300400500600700198119821983198419 8519861987198819891990199119921993199419 9519961997199819992000200120022003200420 0520062007MW05001,0001,5002,0002,5003,00 03,500 Cumulative MW 2001 11 2011 11 2013 2015 5 2017 2017 100km BNetzA CIS 22 IRENA 33 /MWh( /kWh) RENEWABLE ENERGY AUCTIONS ANALYSING 2016 EXECUTIVE SUMMARY IRENA 2017/1/24 33 /MWh( /kWh) PC Grid Parity Supply Chain Gamesa Acciona 2014 Vestas MHI JV(MVOW) Gamesa Areva JV(Adwen)
7 2015 GE Alstom 2016 Nordex Acciona 2017 Siemens Gamesa Senvion FIT 2012 5 5GW Enercon Nordex Senvion) 2000 750kW PMSG 2007 lstom Ecotechnia Areva Multibrid 2014 Areva Gamesa JV Adwen 8MW AD180 2015 Alstom GE 2017 Gamesa Siemens Adwen ClassIII ClassIII FIT CIS 5 8MW LCOE Grid parity LCR Local
8 Contents Requirement 28 3589 2016 3% 1 36% 2 29% 11% 1 813MW 37% 2 691MW 31% 2 592MW 27% 2016 Block Island 30MW 30MW 8 60MW GWEC Global Wind Report 2016 Ten Year Satellite Wind Speed4C Offshore have combined their extensive offshore wind expertise with a reliable high resolution global satellite dataset to develop a 23 year wind speed database. This high resolution observation data ( ) has been obtained from up to 6 satellites operated by NASA. This extract shows mean 10m winds for period 2000-2009.
9 2013 MITSUBISHI HEAVY INDUSTRIES, LTD. All Rights 1/2 43% Super Grid 37 Jack Up barge SEP Seajacks38 JUB/Jack-up barge / 3940 EWEA 2009 Stockholm 14-16 September Port of
10 EsbjergESBJERG LOGISTICS HUB FOR OFFSHORE WIND 40 2015 3 MOU 2016 6 6 BOEM MOU 2016 5 13 42 3 2017 6 14 MVOW vice president Masato Yamada 44 10 kW 37 capacity factor) LifecapacityfactorAge(y)Installedcapacit y(MW)Total (GWh) Anholt 400 3,508 Aved re Holme 11 176 Nysted (R dsand) II 207 3,921 Sprog 21 362 Horns Rev II 209 5,132 Nysted (R dsand) I 166 6,410 Frederikshavn 8 244 Sams 23 973 R nland 17 821 Horns Rev 160 7,379 Middelgrunden 40 1,282 Tun 5 264 5 ,271 30,712 Wind FarmApril 2015 13-15MW Orsted Dong Energy 13-15MW