Transcription of LABOR FORCE STATUS OF THE CIVILIAN NONINSTITUTIONAL ...
1 LABOR FORCE STATUS OF THE CIVILIAN NONINSTITUTIONAL POPULATIONRELEASE DATE: AUGUST 17, 2018 SEASONALLY ADJUSTEDOver-the-MonthOver-the-YearCurre nt MonthMonth AgoYear AgoChangeChangeJuly 2018 June 2018 July 2017 LevelPercentLevelPercentSTATE OF FLORIDAC ivilian NONINSTITUTIONAL Population 16+17,254,00017,230,00016,960,00024, , LABOR Force10,246,00010,233,00010,114,00013, , ,864,0009,846,0009,704,00018, , ,000387,000410,000-4, , Rate (%) STATESC ivilian NONINSTITUTIONAL Population 16+257,843,000257,642,000255,151,000201, ,692, LABOR Force162,245,000162,140,000160,467,00010 5, ,778, ,965,000155,576,000153,511,000389, ,454, ,280,0006,564,0006,956,000-284, , Rate (%)
2 SEASONALLY ADJUSTEDOver-the-MonthOver-the-YearCurre nt MonthMonth AgoYear AgoChangeChangeJuly 2018 June 2018 July 2017 LevelPercentLevelPercentSTATE OF FLORIDAC ivilian NONINSTITUTIONAL Population 16+17,254,00017,230,00016,960,00024, , LABOR Force10,318,00010,291,00010,165,00027, , ,910,0009,892,0009,720,00018, , ,000399,000444,0009, , Rate (%) STATESC ivilian NONINSTITUTIONAL Population 16+257,843,000257,642,000255,151,000201, ,692, LABOR Force163,734,000163,277,000161,911,00045 7, ,823, ,004,000156,465,000154,470,000539, ,534, ,730,0006,812,0007,441,000-82, , Rate (%) : All estimates except unemployment rates are rounded to the nearest thousand.
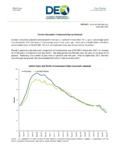
3 Items may not add to totalsor compute to displayed percentages due to rounding. All data are subject to : department of LABOR , bureau of LABOR Statistics, Local Area Unemployment Statistics Program, incooperation with the Florida department of Economic Opportunity, bureau of LABOR Market OF FLORIDALABOR FORCE STATUS OF THE CIVILIAN NONINSTITUTIONAL POPULATION2017-DATESEASONALLY ADJUSTEDRELEASE DATE: AUGUST 17, 2018 CIVILIANNONINSTITUTIONALCIVILIANUNEMPLOY MENTPOPULATIONLABORMONTH(AGES 16+)FORCEEMPLOYMENTLEVELRATE (%)2017 January16,819,00010,015,0009,554,000461, ,841,00010,040,0009,587,000453, ,863,00010,061,0009,618,000444, ,887,00010,079,0009,644,000434, ,910,00010,093,0009,667,000425, ,935,00010,103,0009,686,000417, ,960,00010,114,0009,704,000410, ,986,00010,123,0009,719,000404, ,013,00010,133,0009,734,000399, ,040,00010,139,0009,744,000396, ,066,00010,140,0009,743,000396, ,090,00010,138,0009,741,000397, ,115,00010,152,0009,754,000397, ,136,00010,176,0009,778,000398, ,159,00010,193,0009,793,000400, ,182,00010,205,0009,807,000398, ,205,00010,217,0009,826,000391, ,230,00010,233,0009,846,000387, ,254,00010,246,0009,864,000383.
4 All estimates except unemployment rates have been rounded to the nearest thousand. Items maynot add to totals or compute to displayed percentages due to rounding. All data are subject to : department of LABOR , bureau of LABOR Statistics, Local Area Unemployment Statistics Program, in cooperation with the Florida department of Economic Opportunity, bureau of LABOR Market STATESLABOR FORCE STATUS OF THE CIVILIAN NONINSTITUTIONAL POPULATION2017-DATESEASONALLY ADJUSTEDRELEASE DATE: AUGUST 3, 2018 CIVILIANNONINSTITUTIONALCIVILIANUNEMPLOY MENTPOPULATIONLABORMONTH(AGES 16+)FORCEEMPLOYMENTLEVELRATE (%)January254,082,000159,718,000152,076, 0007,642, ,246,000159,997,000152,511,0007,486, ,414,000160,235,000153,064,0007,171, ,588,000160,181,000153,161,0007,021, ,767,000159,729,000152,892,0006,837, ,957,000160,214,000153,250,0006,964, ,151,000160,467,000153,511,0006,956, ,357,000160,598,000153,471,0007,127, ,562,000161,082,000154,324,0006,759, ,766,000160,371,000153,846,0006,524, ,949,000160,533,000153,917,0006,616, ,109,000160,597,000154,021,0006,576, ,780,000161,115,000154,430,0006,684, ,934,000161,921,000155,215,0006,706, ,097,000161,763,000155,178,0006,585, ,272,000161,527,000155,181,0006,346, ,454,000161,539,000155,474,0006,065, ,642,000162,140.
5 000155,576,0006,564, ,843,000162,245,000155,965,0006,280, : All data except unemployment rates are rounded to the nearest thousand. Items may not add to totalsor compute to displayed percentages due to rounding. All data are subject to : department of LABOR , bureau of LABOR Statistics, Current Population OF FLORIDALABOR FORCE STATUS OF THE CIVILIAN NONINSTITUTIONAL POPULATION2017-DATENOT SEASONALLY ADJUSTEDRELEASE DATE: AUGUST 17, 2018 CIVILIANNONINSTITUTIONALCIVILIANUNEMPLOY MENTPOPULATIONLABORMONTH(AGES 16+)FORCEEMPLOYMENTLEVELRATE (%)2017 January16,819,0009,961,0009,483,000479, ,841,00010,013,0009,571,000443, ,863,00010,080,0009,660,000419, ,887,00010,091,0009,692,000399, ,910,00010,121,0009,712,000408, ,935,00010,128,0009,689,000439, ,960,00010,165,0009,720,000444, ,986,00010,106,0009,666,000439, ,013,00010,203,0009,792,000411, ,040,00010,128,0009,737,000391, ,066,00010,116,0009,727,000389, ,090,00010,092,0009,720,000372, Average16,951,00010,100,0009,681,000419, ,115,00010,136,0009,719,000418, ,136,00010,228,0009,839,000388, ,159,00010,228,0009,841,000387, ,182,00010,203,0009,855,000348, ,205,00010,270,0009,925,000345, ,230,00010,291,0009,892,000399, ,254,00010,318,0009,910.
6 000408, AverageNote: All estimates except unemployment rates have been rounded to the nearest thousand. Items maynot add to totals or compute to displayed percentages due to rounding. All data are subject to : department of LABOR , bureau of LABOR Statistics, Local Area Unemployment Statistics Program, in cooperation with the Florida department of Economic Opportunity, bureau of LABOR Market STATESLABOR FORCE STATUS OF THE CIVILIAN NONINSTITUTIONAL POPULATION2017-DATENOT SEASONALLY ADJUSTEDRELEASE DATE: AUGUST 3, 2018 CIVILIANNONINSTITUTIONALCIVILIANUNEMPLOY MENTPOPULATIONLABORMONTH(AGES 16+)FORCEEMPLOYMENTLEVELRATE (%)2017 January254,082,000158,676,000150,527,000 8,149, ,246,000159,482,000151,594,0007,887, ,414,000159,912,000152,628,0007,284, ,588,000159,817,000153,262,0006,555, ,767,000159,979,000153,407,0006,572, ,957,000161,337,000154,086,0007,250, ,151,000161,911,000154,470,0007,441, ,357,000160,863,000153,576,0007,287, ,562,000161,049,000154,494,0006,556, ,766,000160,465,000154,223,0006,242, ,949,000160,466,000154,180,0006,286, ,109,000159,880,000153,602,0006,278, Average255,079,000160,320,000153,337,000 6,982, ,780,000160,037,000152,848,0007,189, ,934,000161,494,000154,403,0007,091, ,097,000161,548,000154,877,0006,671, ,272,000161,280,000155,348,0005,932.
7 454,000161,765,000156,009,0005,756, ,642,000163,277,000156,465,0006,812, ,843,000163,734,000157,004,0006,730, AverageNote: All data except unemployment rates are rounded to the nearest thousand. Items may not add to totalsor compute to displayed percentages due to rounding. All data are subject to : department of LABOR , bureau of LABOR Statistics, Current Population Survey.