Transcription of Lectrure Thermal Analysis
1 Thermal AnalysisTGA / DTAL inda Fr bergOutline Definitions What is Thermal Analysis ? Instrumentation & origin of the TGA-DTA signal. TGA DTA Phase diagrams & Thermal Analysis Thermal Analysis ,an experimental method to determine phase diagrams. Basics and applicationsNomenclature of Thermal AnalysisDefinition of the field of Thermal Analysis (TA) Thermal Analysis (TA) is a group of techniques that study the properties of materials as they change with temperatureICTAC (International Confederation for Thermal Analysis and Calorimetry) Thermal Analysis In practice Thermal Analysis gives properties like; enthalpy, Thermal capacity, mass changes and the coefficient of heat expansion.
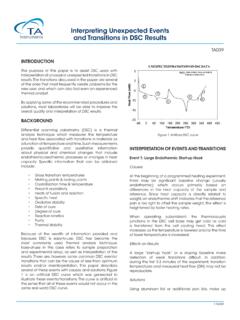
2 Solid state chemistry uses Thermal Analysis for studying reactions in the solid state, Thermal degradation reactions, phase transitions and phase diagrams. Thermogravimetric Analysis (TGA): mass Differential Thermal Analysis (DTA): temperature difference Differential scanning calorimetry (DSC): heat difference Pressurized TGA (PTGA): mass changes as function of pressure. Thermo mechanical Analysis (TMA): deformations and dimension Dilatometry (DIL): volume Evolved gas Analysis (EGA): gaseous decomposition productsOften different properties may be measured at the same time:TGA-DTA, TGA-EGA.
3 Includes several different methods. These are distinguished from one another by the property which is analysisInstrumentation & origin of the TGA-SDTA signalTGA - SDTAM ettler - ToledoLeena Hupa & Daniel LindbergA modern TGA - DTAF urnace componentsSample crucible Sample holdersDTA thermoelementBalance armHeating resistorRective purge gas inletFurnace thermoelementHeating resistorOperating range: Heating rate: Typical heating rate: - 200 - 1600 C up to 100 C/min 10 20 C/min Heat transfer from crucible to recording microbalance & thermo elementsplatinumOrigin of the TGA-DTA signalTemperatureTp, TrTp: program temperatureTr: reference temperature = Tc furnace temperatureTs: sample temperatureSchematic diagram showing the different temperatures in the DTA during a Thermal onsetReaction temperatureOrigin of the TGA-DTA signalTemperatureTp, TrTp: program temperatureTr.
4 Reference temperatureTs: sample temperatureTsTemperaturePeak onsetReaction temperatureEndothermic peakOrigin of the TGA-DTA signalTp: program temperatureTc: furnace temperatureTs: sample temperatureMelting point: IndiumHeating rate 50 K / min t TTime / min t = Tau lagTsTpTcTGAT hermo Gravimetric AnalyisTGA, BasicsMeasures changes in weight in relation to changes in measured weight loss curve gives information on: changes in sample composition Thermal stability kinetic parameters for chemical reactions in the sampleA derivative weight loss curve can be used to tell the point at which weight loss is most apparent TGA.
5 Phenomena causing mass changesPhysicalGas adsorptionGas desorptionPhase transitions Vaporization Sublimation ChemicalDecomposition Break down reactionsGas reactionsChemisorption (adsorption by means of chemicalinstead of physical forces)TGA: Applications Characterization of Thermal stability Material purity Determination of humidity Examination of Corrosion studies ( oxidation or reactions with reactive gases) Gasification processes Kinetic processesTypical temperature-time programsTtConstant heating rateTtGradually isothermicTtIsothermicExperimentalSample size: 1 100 mg (typically 5 20 mg)Heating / cooling rate: 1 50 C / minTGA Ex.
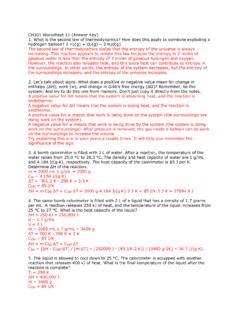
6 Decomposition of calcium oxalate monohydrate Calcium oxalat monohydrat, a standard material often used to demonstrate TGA performance. Exhibits three weight losses with temperature in an inert atmosphere ( N2).CaC2O4 H2O CaC2O4 CaCO3 CaO-H2O-CO-CO2-H2O-CO-CO2 TGA Ex. Decomposition of calcium oxalat monohydrateAbsolute confirmation of the decomposition process is possible when the gaseous by products are identified as they evolve, eg. by mass spectrometry (MS).TGDTGTGAC ommon gaseous components originating from inorganic materials that decompose before the melting point: H2O, CO, CO2, SOx, NOx, Cl2, F2, CH3OH, some chemical reactions in solid phase result in gaseous weight loss ex.
7 Na2CO3(s) + SiO2(s) Na2 SiO3(s) + CO2(g)Factors affecting the TG curveHeating rate Sample sizeParticle size of samplePacking Crucible shapeGas flow rateIncreases the temperature at which sample decomposition the progress of ther reactionDTAD ifferential Thermal AnalysisDTA, BasicsThe material under study and an inert reference are made to undergo identical Thermal temperature difference between sample and reference is this technique the heat flow to the sample and reference remain the same rather than the , BasicsThe differential temperature is then plotted against time, or against temperature (DTA curve or thermogram).
8 Crystallization exothermicMelting endothermicPeak orientation in DTA thermogram depends on Instrument manufacturerDTA; Phenomena causing changes in heat / temperaturePhysicalAdsorption( exothermic )Desorption( endothermic )A change in crystal structure(endo or exothermic )Crystallization ( exothermic )Melting( endothermic )Vaporiza tion ( endothermic )Sublimation ( endothermic )ChemicalOxidation ( exothermic )Reduction ( endothermic )Break down reactions (endo or exothermic )Chemisorption ( exothermic )Solid state reactions (endo or exothermic )
9 Evaluation and interpretation of DTA curvesTSample T ReferenceTemperature5 K /min, mg 5 K /min, 6, 3 mg10 K /min, 6, 3 mg20 K /min, 6, 3 mgOnset Onset - melting Endset Integral - enthalpy h Peak temp - melting Peak height Peak widthTypical data obtained from DTA peak evaluationPeak temperature is affected by heating rate & sample mass, but not by h (enthalpy) and T onset. TGA- DTA Keys for successful experimental practice Raw materials should be of high purity. Fine -grained powder should be used to achieve greater contact area and better equilibrium conditions.
10 The time at any temperature must be sufficiently long in order to permit completeness of affecting the heat transfer, Tau lag & signalingTGA- DTA Keys for successful experimental practiceCrucibleMaterialMassVolumeHeat capacitySampleMassHeat capacityHeat conductivityAtmospherePhase diagrams & Thermal Analysis Phase Diagram A phase diagram show conditions at which thermodynamically distinct phases can occur at equilibrium. It is determined experimentally by recording cooling rates over a range of compositions. Phase transitions occur along lines of equilibrium (=phase boundaries).