Transcription of LECTURE NOTES #6: Correlation and Regression
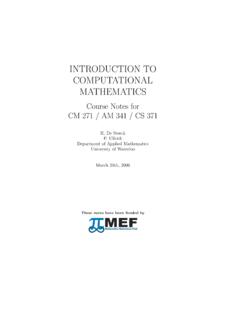
1 LECTURE NOTES #6: Correlation and Regression6-1 Richard GonzalezPsych 613 Version (Nov 2021) LECTURE NOTES #6: Correlation and RegressionReading assignment: Stay current with the readingKNNL Chapters 1, 2, 3, 4, and 15; CCWA chapters 1 and 2 There are several ways to think about Regression , and we will cover a few of them. Each perspective,or way of thinking about Regression , lends itself to answering different research questions. Usingdifferent perspectives on Regression will show us the generality of the technique, which will help ussolve new types of data analysis problems that we may encounter in our Describing bivariate bivariate normal distribution generalizes the normal distribution.
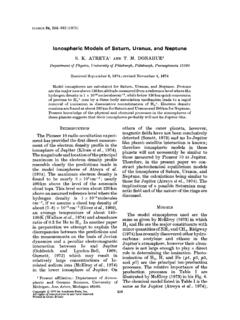
2 See Figure 6-1 we want to find the relationship 1, or association, between two variables. Thiscan be done visually with a scatter plot. Examples of scatter plots are given in Figures 6-2and 6-3 with n=20 and n=500, Correlation is a quantitative measure to assess the linear association between two vari-ables. The Correlation can be thought of as having two parts: one part that measures theassociation between variables and another part that acts like a normalizing constant. Thefirst part is called the covariance.
3 To understand better the concept of covariance recall thedefinition of sums of squaresSY=X(Y Y)2(6-1)=X(Y Y)(Y Y)(6-2)This is the sum of the product of the differences between the scores and the mean. Theestimated variance of Y isSYN 1(6-3)1 Some people quibble about whether to refer to a Correlation between two variables as a relation or a relationship .I suppose proper usage would have a relation refer to two variables and a relationship refer to the bond between twopeople.
4 But I m not bothered such things and tend to use NOTES #6: Correlation and Regression6-2 Figure 6-1: Bivariate Density Function-4-2 024X-4-2 024Y ; s1=s2=1; rho= $ $ ; s1=s2=1; rho=0-4-2 024X-4-2 024Y ; s1=s2=1; rho= $ $ ; s1=s2=1; rho= 024X-4-2 024Y ; s1=s2=1; rho= $ $ ; s1=s2=1; rho= NOTES #6: Correlation and Regression6-3 Figure 6-2: Varying : Each scatter plot contains a sample with 20 points. xy-2-101-3-2-10123mu1=mu2=0; s1=s2=1; rho=0 xy-2-101-3-2-10123mu1=mu2=0; s1=s2=1; rho= ; s1=s2=1; rho= ; s1=s2=1; rho= ; s1=s2=1; rho= xy-1012-3-2-10123mu1=mu2=0; s1=s2=1; rho= xy-1012-3-2-10123mu1=mu2=0; s1=s2=1; rho= xy-2-101-3-2-10123mu1=mu2=0; s1=s2=1.
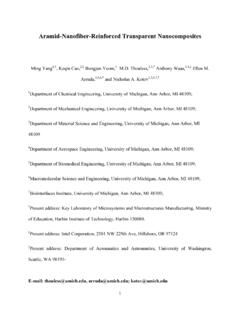
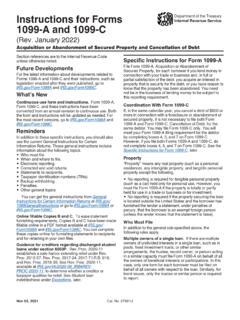
5 Rho= NOTES #6: Correlation and Regression6-4 Figure 6-3: Varying : Each scatter plot contains a sample with 500 points.
6 Xy-3-2-10123-3-2-10123mu1=mu2=0; s1=s2=1; rho=0
7 Xy-3-2-1012-3-2-10123mu1=mu2=0; s1=s2=1; rho=
8 Xy-3-2-10123-3-2-10123mu1=mu2=0; s1=s2=1; rho=
9 Xy-3-2-10123-3-2-10123mu1=mu2=0; s1=s2=1; rho=
10 Xy-2-10123-3-2-10123mu1=mu2=0; s1=s2=1; rho=