Transcription of Life Tables for 1949-51
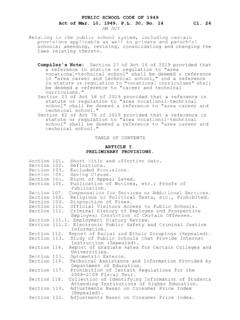
1 L I F E Tables FOR ..- 1949-51 . U. S. DEPARTMENT OF. HEALTH, EDUCATION, A N D WELFARE. Public Health Service Natio nal Office of Vital Statistics U. S. DEPARTMENT OF HEALTH, EDUCATION, AND WELFARE. b r t h u r S. F l e m n i w , S e c r e t a r y Public Health Service Leroy E . burney, Zurnecn Geperal L I F E T A B L E S FOR 1949-51 . VITAL STATISTICS-SPECIAL REPORTS. Volume 41, Numbers I through 5. CONTENTS. Number Page 1. 1. 2. 33. 3. 53. 4. 71. 5. 149. November 23, 1954 Volume 41, Number I. VITAL STATISTICS-SPECIAL REPORTS. life Tables FOR 1949-51 . United States life Tables U. S. DEPARTMEN1 OF HEALTH, EDUCATION, AND WELFARE. Public Health Service National Office of Vital Statistics CONTE N T S. 1. 8. 2. 10. 3. 12. 4. 14. 5. 16. 6. 18. 7. 20. 8. 22. 9. 24. 10. 26. 11. 28. 12. 30. 3.
2 United States life Tables : 1848-51. By Honroe G. Sirken, Chief, Actuarial Analysis Section and Gustav A. Carlson, Health Prqrm Representative Detailed life Tables , 1949-51 these measures is a closed cohort f o r each of the population groups under examination which is assumed This report contains detailed life Tables for the to be subject throughout life to the mortality rates United States, 1949-51 . They are the most recent in of that period. For example, table 1 presents a life a series of life Tables that have been prepared at 10- table for the total population showing the progress of year intervals for the death-registration States, which a cohort starting with 100,000 live births and subject originated with those for 1900-1902. Each of the throughout life tothe average mortality rates for the Tables in the series is based on a census of population 3-year period 1949-51 .
3 A d deaths in a 3-year period containing the census The customary measure of the comparative lon- year. The life Tables in this report are based on the gevity of different populations is the average duration 1950 census of population and deaths of the 3-year of life , also called the expectation of life at birth. period 1949-51 for the entire continental United States. This is the average number of y e a r s lived by the In deriving life table values at ages under 5, use members of the life table cohort. In each of the was made, also, of reported births for each of the Tables , the average duration of life appears opposite 8 years 1944 to 1951, and of deaths for the same years. age 0 i n the column which gives the average re- Nine detailed life Tables a r e contained in this report.
4 Maining lifetime. These values indicate that females, life Tables a r e given for whites and nonwhites, sep- on the average, live longer than males, and white arately by sex, and for both sexes combined, and also persons longer than nonwhite. The expectation of life f o r the total population and for total males and total at birth i s years for white males, years females. for white females, years for nonwhite males, and The accuracy of the life table values for 1949-51 years for nonwhite females. probably compares favorably with the accuracy of the There is, however, some objection to the use of statistics on which they a r e based. However, it is the average duration of life as a standard of compari- well known that the basic statistics a r e subject to son because the method of calculating it'gives great various e r r o r s , the magnitude of which is usually weight to the relatively large number of deaths occur- difficult to estimate precisely.
5 Prior to the calcula- ring in the first year of life . This influence may be tion of the values of the life Tables , the more serious entirely eliminated by considering instead the average e r r o r s were examined carefully, and the basic data lifetime remaining to those members of the cohort were adjusted to remove e r r o r s when corrections surviving to age 1, o r , in other words, the expec- were available or could be derived. It should be noted tation of life a t age 1. A s a result of this change, that the population and mortality statistics a t the the differences between these various groups are oldest ages were least trustworthy. Special methods somewhat reduced. Nevertheless, durihg 1949-51 . were devised to determine the proportions dying at white females still live, on the average, years ages over 87 for nonwhites and at ages over 92 for longer than white males, and years longer than whites.
6 Therefore, the life table values at the oldest nonwhite females, while white males live years ages are more likely to contain e r r o r s than those longer than nonwhite males. at other ages, and, in fact, they may not necessarily Another possible standard for comparing the represent actual conditions. longevity of different populations is provided by the A later publication will contain a complete state- median length of life , or probable lifetime, which is ment of the adjustments made in the basic data and of the age at which half of the original members of the the methods and formulas by which the life Tables cohort have died. When the life table cohort starts were prepared. with 100,000 births, this would be the age at which there are just 50,000 survivors, In other words, it is life table values, 1949-51 the age to which an infant born alive has j u s t an wen chance of surviving.
7 In computing this median length The rates of mortality during a specific period of life , the deaths in the age groups in which the may be summarized by the life table method to obtain median age lies are assumed to be evenly distributed, measures of comparative longevity. The basis of Thus, the median length of life on the basis of 1949-51 . 5. VITAL STATISTICS-SPECIAL REPORTS. 6. this period. p. --k I. mortality rates for white males is determined to be I. years; for white females, years; for non- It seems unlikely that variations in the scope of white males, years; and for nonwhite females, the life Tables from period to period would seriously a years. It is evident that the median length of bias the major trends in the values for 1900-1951. ,I. life is longer than the average duration of life for all However, it is believed that the fluctuations shown at groups.
8 Certain ages in the values for Negroes during the Still another measure of comparative longevity first 30 years of the century may be attributable, in is the number of persons surviving to stated ages in part, to the expanding character of the death-regis- a cohort, of, say, 100,000 live births. For example, tration area, and, in part, to progressive improve- it is of some interest to examine the proportions of ment in the completeness of death reporting. survivors to ages 21 and 65, since these ages may During the first half of this century, there w a s a be taken as representing, respectively, the attainment spectacular improvement in the expectation of life for of manhood o r womanhood, and the retirement age all four subdivisions of the population by race and sex. prescribed by the Social Security Act.
9 A t age 21, The improvement in longevity has been appreciably the ratio of nonwhite to white survivors in the 1949-51 greater for females than for males, and for nonwhites life Tables is 97 percent, and at age 65 the ratio is 70 than for whites. The relative improvement in the percent. This marked difference indicates the cumu- longevity of females is particularly striking because lative effect of higher mortality among nonwhites in it has increased the disparity in the expectation of the intervening ages. The corresponding ratios of life between the sexes. The average duration of life males to females a r e 98 percent and 83 percent. ( table 12) has increased by years for white males, years for white females, years for Trend of life table values for 1900-1951 nonwhite males, and years for nonwhite females.
10 The proportion dying during the first year of life Selected life table values for five decennial life ( table 1 0 ) has decreased by 77 percent for white Tables covering the period 1900 to 1951 are given in males, 79 percent for white females, 80 percent for Tables 10-12, by race and sex. In using these Tables nonwhite males, and 81 percent for nonwhite females. it must be remembered that values for earlier periods The number attaining age 65 in a life table cohort are not strictly comparable with those for later peri- of 100,000 live births ( table 11) has increased by ods. The area covered at each period was limited by 24,296 for white males, by 32,967 for white females, the number of death-registration States, and values by 26,183 for nonwhite males, and by 30,-363 for non- for periods prior to 1929-31 do not cover the entire white females.