Example: quiz answers
Logistic Regression in Rare Events Data
First, although the statistical properties of linear regression models are invariant to the (unconditional) mean of the dependent variable, the same is not true for binary dependent variable models. The mean of a binary variable is the relative frequency of events in the
Tags:
Information
Domain:
Source:
Link to this page:
Documents from same domain
Advanced Quantitative Research Methodology, Lecture …
gking.harvard.eduThe Problem: Discovery from Unstructured Text Examples: scholarly literature, news stories, medical information, blog posts, comments, product reviews, emails, social ...
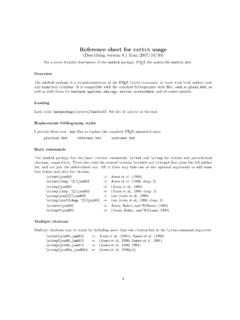
Reference sheet for natbib usage
gking.harvard.eduReference sheet for natbib usage (Describing version 8.1 from 2007/10/30) For a more detailed description of the natbib package, LATEX the source le natbib.dtx. Overview The natbib package is a reimplementation of the LATEX \cite command, to work with both author{year and numerical citations.

Natural Sciences Citations and References (Author{Year and ...
gking.harvard.eduNATURAL SCIENCES CITATIONS AND REFERENCES 5 These .bst les are not meant to be exhaustive by any means. Other style les conforming to the natbib format exist, or may be generated with my custom-bib (also known as makebst) program. 2.2 The Syntax of the thebibliography The information on the cited author names and year are given as part of
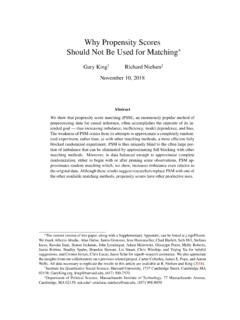
Why Propensity Scores Should Not Be Used for Matching
gking.harvard.eduWhy Propensity Scores Should Not Be Used for Matching Gary Kingy Richard Nielsenz November 10, 2018 Abstract We show that propensity score matching (PSM), an enormously popular method of preprocessing data for causal inference, often accomplishes the opposite of its in-tended goal — thus increasing imbalance, inefficiency, model dependence ...
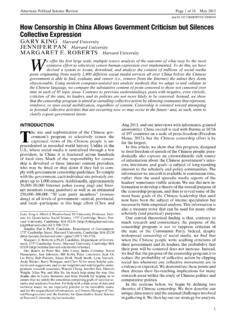
How Censorship in China Allows Government Criticism but ...
gking.harvard.eduernment’s program to selectively censor the expressed views of the Chinese people is un-precedented in recorded world history. Unlike in the U.S., where social media is centralized through a few providers, in China it is fractured across hundreds of local sites. Much of the responsibility for censor-ship is devolved to these Internet content ...

The Parable of Google Flu: Traps in Big Data Analysis
gking.harvard.eduMar 14, 2014 · for, rather than a supplement to, traditional data collection and analysis. Elsewhere, we have asserted that there are enormous scien-fi c possibilities in big data ( 9– 11). How-ever, quantity of data does not mean that one can ignore foundational issues of mea-surement and construct validity and reli-ability and dependencies among data (12).
Related documents

A.1 SAS EXAMPLES
users.stat.ufl.edumodels using ML or Bayesian methods, cumulative link models for ordinal responses, zero-in ated Poisson regression models for count data, and GEE analyses for marginal models. PROC LOGISTIC gives ML tting of binary response models, cumulative link models for ordinal responses, and baseline-category logit models for nominal responses.
Logit Models for Binary Data
data.princeton.eduLogit Models for Binary Data We now turn our attention to regression models for dichotomous data, in-cluding logistic regression and probit analysis. These models are appropriate when the response takes one of only two possible values representing success and failure, or more generally the presence or absence of an attribute of interest.

Introduction to Binary Logistic Regression
wise.cgu.edu17 Binary logistic regression 21 Hierarchical binary logistic regression w/ continuous and categorical predictors 23 Predicting outcomes, p(Y=1) for individual cases 24 Data source, reference, presenting results 25 Sample results: write-up and table 26 How to graph logistic models with Excel 27 Plot of actual data for comparison to model 28 How ...

Multinomial Logistic Regression Models
socialwork.wayne.edusequence of binary models. In some cases, it makes sense to “factor” the response into a sequence of binary choices and model them with a sequence of ordinary logistic models. For example, consider the study of the effects of radiation exposure on mortality. The four-level response can be modeled in three stages: Population Alive Dead Non ...

Hierarchical Models - Princeton University
www.cs.princeton.edu• The two regression models everyone has heard of are – Linear regression for continuous responses, yi jxi »N (fl >x i,¾ 2) (6) – Logistic regression for binary responses (e.g., spam classification), p(yi ˘1jxi)˘logit(fl>xi) (7) – In both cases, the distribution of the response is governed by the linear combina-

An Introduction to Logistic Regression Analysis and Reporting
datajobs.comLogistic Regression Models The central mathematical concept that underlies logistic regression is the logit—the natural logarithm of an odds ratio. The simplest example of a logit derives from a 2 ×2 contingency table. Consider an instance in which the distri- ... If a predictor is binary, as in the Table 1 example, then the odds ratio is ...

An Introduction to Logistic and Probit Regression Models
www.liberalarts.utexas.eduModeling a Binary Outcome • Latent Variable Approach • We can think of y* as the underlying latent propensity that y=1 • Example 1: For the binary variable, heart attack/no heart attack, y* is the propensity for a heart attack. • Example 2: For the binary variable, in/out of the labor force, y* is the propensity to be in the labor force. ...

Maximum Likelihood Estimation of Logistic Regression ...
czep.netMaximum Likelihood Estimation of Logistic Regression Models 2 corresponding parameters, generalized linear models equate the linear com-ponent to some function of the probability of a given outcome on the de-pendent variable. In logistic regression, that function is the logit transform: the natural logarithm of the odds that some event will occur.

11 Logistic Regression - Interpreting Parameters
www.unm.edu11 LOGISTIC REGRESSION - INTERPRETING PARAMETERS 11 Logistic Regression - Interpreting Parameters Let us expand on the material in the last section, trying to make sure we understand the logistic regression model and can interpret Stata output. Consider first the case of a single binary predictor, where x = (1 if exposed to factor 0 if not;and y =
Classification and regression trees
pages.stat.wisc.eduneighbor models in the nodes. GUIDE also can pro-duce ensemble models using bagging16 and random forest17 techniques. Table 1 summarizes the features of the algorithms. To see how the algorithms perform in a real ap-plication, we apply them to a data set on new cars for the 1993 model year.18 There are 93 cars and 25 variables.