Example: marketing

Loudness Comparison Chart - Caltrans

Loudness Comparison Chart (dBA)1101009080706050403020100 Noise Level(dBA)Rock BandJet Fly-over at 1000 ftCommon OutdoorActivitiesCommon IndoorActivitiesFood Blender at 3 ftGarbage Disposal at 3 ftVacuum Cleaner at 10 ftNormal Speech at 3 ftLarge Business OfficeDishwasher Next RoomLibraryConcert Hall (Background)Bedroom at Night,Large Conference Room (Background)Theater,Broadcast/Recording StudioLowest Threshold of Human HearingGas Lawn Mower at 3 ftDiesel Truck at 50 ft at 50 mphGas Lawn Mower at 100 ftNoisy Urban Area, DaytimeCommercial AreaHeavy Traffic at 300 ftQuiet Urban, DaytimeQuiet Urban, NighttimeQuiet Suburban, NighttimeQuiet Rural, NighttimeLowest Threshold of Human HearingAn increase of 3 dBA is barely perceptible to the human ear.

LOUDNESS COMPARISON CHART (dBA) 110 100 90 80 70 60 50 40 30 20 10 0 Noise Level (dBA) Jet Fly-over at 1000 ft Rock Band Common Outdoor Activities Common Indoor …

Tags:

  Chart, Comparison, Loudness comparison chart, Loudness

Information

Domain:

Source:

Link to this page:

Please notify us if you found a problem with this document:

Other abuse

Transcription of Loudness Comparison Chart - Caltrans

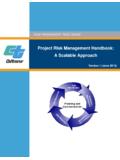
1 Loudness Comparison Chart (dBA)1101009080706050403020100 Noise Level(dBA)Rock BandJet Fly-over at 1000 ftCommon OutdoorActivitiesCommon IndoorActivitiesFood Blender at 3 ftGarbage Disposal at 3 ftVacuum Cleaner at 10 ftNormal Speech at 3 ftLarge Business OfficeDishwasher Next RoomLibraryConcert Hall (Background)Bedroom at Night,Large Conference Room (Background)Theater,Broadcast/Recording StudioLowest Threshold of Human HearingGas Lawn Mower at 3 ftDiesel Truck at 50 ft at 50 mphGas Lawn Mower at 100 ftNoisy Urban Area, DaytimeCommercial AreaHeavy Traffic at 300 ftQuiet Urban, DaytimeQuiet Urban, NighttimeQuiet Suburban, NighttimeQuiet Rural, NighttimeLowest Threshold of Human HearingAn increase of 3 dBA is barely perceptible to the human ear.


Related search queries