Example: biology
Making Frequency Table - My Math Classes
Elementary Statistics Making Frequency Table Objective: 1 Find the minimum and the maximum value. 2 Find the value of the range. 3 Find the class width if we wish to have a frequency distribution table with 5 classes. Solution: Since our data is …
Tags:
Information
Domain:
Source:
Link to this page:
Documents from same domain
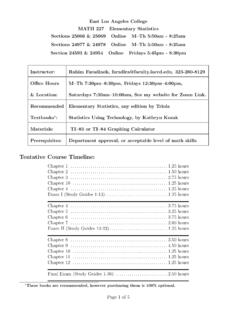
East Los Angeles College MATH 227 Elementary …
www.mymathclasses.comEast Los Angeles College MATH 227 Elementary Statistics Section 10415 G5–114 Th Fr 1:00pm - 3:45pm Instructor: Rahim Faradineh, Phone: 323-260-8129, email: rfaradineh@gmail.com
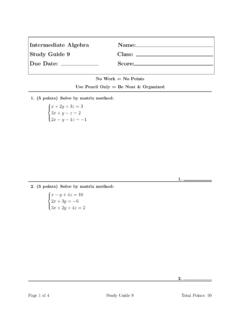
Intermediate Algebra Study Guide 9 - MyMathClasses
www.mymathclasses.com6. (5 points) A local store sells two types of candy, one at $1.50 and the other $1.00 per pound. We need 50pounds at $1.32per pound. Use system of linear equations

Chapter 8 Overview - MyMathClasses
www.mymathclasses.com3 Slide 13 Copyright © 2004 Pearson Education, Inc. The test statistic is a value computed from the sample data, and it is used in making the decision about the ...

Chapter 6: Continuous Probability Distributions
www.mymathclasses.comChapter 6: Continuous Probability Distributions 179 The equation that creates this curve is f(x)= 1!2" e # 1 2 x#µ 2. Just as in a discrete probability distribution, the object is to find the probability of an
Related documents

Chapter 17: Fundamentals of Time and Frequency
tf.nist.govfor frequency measurements is usually at a frequency of 1 MHz or higher, with 5 or 10 MHz being common. Frequency signals are usually sine waves, but can also be pulses or square waves. If the frequency signal is an oscillating sine wave, it might look like the one shown in Fig. 17.1. This signal produces one cycle (360 ∞ or 2 π

Wave Speed, Frequency, & Wavelength Practice Problems
www.chemunlimited.comA low-frequency radio wave has a frequency of 250,000Hz. What is the wavelength of this radio wave? (Hint: Don’t forget that this is an electromagnetic wave, and therefore you should automatically know its speed.) 4. A certain microwave has a wavelength of 0.032 meters. Calculate the frequency of this microwave. v = f c = 300,000,000m/s

Behavior Assessment: Frequency and Interval Recording Est ...
iris.peabody.vanderbilt.eduFrequency (or event) recording is a way to measure the number of times a behavior occurs within a given period. Frequency recording is best for behaviors with a distinct beginning and end. To conduct an event or frequency tally: 1. Note the time the observation begins. 2. Record each occurrence of the behavior.

The Considerate Operator’s Frequency Guide
www.arrl.orgNo frequency will be assigned for the exclusive use of any station.” No one “owns” a frequency. It’s good practice — and plain old common sense — for any operator, regardless of mode, to check to see if the frequency is in use prior to engaging operation. If you are there first, other operators should make an effort to protect you ...

Adverbs of Frequency
www.press.umich.eduAdverbs of frequency are words that tell how often something happens: always, usually, often, sometimes, rarely, seldom, never. Rule 2. In a sentence, an adverb of frequency usually comes after be but before other verbs. When a verb has two parts (has eaten), the adverb of frequency occurs between the two parts (has never eaten). Rule 3.

Chapter 2: Frequency Distributions and Graphs (or making ...
math.ucdenver.eduFrequency distribution – the organization of raw data in table form, using classes and frequencies. Class – a quantitative or qualitative category. A class may be a range of numerical values (that acts like a “category”) or an actual category. Frequency – the number of data values contained in a specific class.
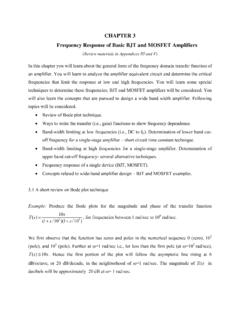
CHAPTER 3 Frequency Response of Basic BJT and MOSFET ...
users.encs.concordia.cafunction. For the low-frequency segment (i.e., TL(s)) of the magnitude plot this will be designated by fL (or ωL =2π fL). In a practical case the function TL(s) may have several poles and zeros at low frequencies. The pole which is closest to the flat mid-band value is known as the low frequency dominant pole of the system. Thus it is the pole of highest magnitude among all the …

Frequency Response of Circuit - cpp.edu
www.cpp.eduFrequency Response of a Circuit ω = max 1 c 2 Hj H The transfer function magnitude is decreased by the factor 1/√2 from its maximum value is called cutoff frequency Cutoff Frequency |H max | is the maximum magnitude of the transfer function ECE 307-4 8 Frequency Response of a Circuit Low-Pass Filter A Serial RL Circuit R Hs L R s L = + 0 i ...

Frequency Response with MATLAB Examples
www.halvorsen.blogfrequency component is a sinusoidal signal having certain amplitude and a certain frequency. • The frequency response is an important tool for analysis and design of signal filters and for analysis and design of control systems. • The frequency response can be found experimentally or from a transfer function model.