Transcription of Making Tables and Figures - Suny Cortland
1 Making Tables and Figures Don Quick Colorado State University Tables and Figures are used in most fields of study to provide a visual presentation of important information to the reader. They are used to organize the statistical results of a study, to list important tabulated information, and to allow the reader a visual method of comparing related items. Tables offer a way to detail information that would be difficult to describe in the text. A figure is a graphic or pictorial representation, such as a chart, graph, photograph, or line drawing. These Figures may include pie charts, line charts, bar charts, organizational charts, flow charts, diagrams, blueprints, or maps.
2 Limit Figures to situations in which a visual helps the reader understand the methodology or results. Use a table to provide specific numbers and summary text, and use Figures for visual presentations. The meaning and major focus of the table or figure should be evident to the readers without their having to make a thorough study of it. A glance should be all it takes for the idea of what the table or figure represents to be conveyed to the reader. By reading only the text itself, the reader may have difficulty understanding the data; by constructing Tables and Figures that are well presented, readers will be able to understand the study results more easily.
3 The purpose of this appendix is to provide guidelines that will enhance the presentation of research findings and other information by using Tables and Figures . It will highlight the important aspects of constructing Tables and Figures using the Publication Manual of the American Psychological Association, Sixth Edition (2010) as the guide for formatting. General Considerations Concerning Tables Be selective as to how many Tables are included in the total document. Determine how much data the reader needs to comprehend the material, and then decide if the information would be better presented in the text or as a table .
4 A table containing only a few numbers is unnecessary, whereas a table containing too much information may not be understandable. Tables should be easy to read and interpret. If at all possible, combine Tables that repeat data, so that results are presented only once. Keep a consistency to all of your Tables throughout your document. All Tables and Figures in your document should use a similar format, with the results organized in a comparable fashion. Use the same name and scale in all Tables , Figures , and the text that use the same variable. In a final manuscript such as a thesis or dissertation, adjust the column headings or spacing between columns so the width of the table fits appropriately between the margins.
5 Fit all of one table on one page. Reduce the data, change the type size, or decrease line spacing to make it fit. A. short table may be on a page with text as long as it follows the first mention of it. Each long table is on a separate page immediately after it is mentioned in the text. If the fit and appearance would be improved, turn the table sideways (landscape orientation, with the top of table toward the spine) on the page. 199. 200 APPENDIX C. Each table and figure must be discussed in the text. An informative table will supplement but will not duplicate the text.
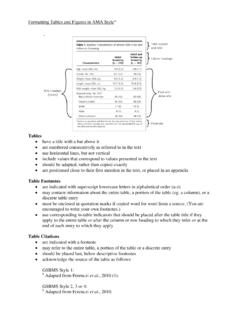
6 In the text, discuss only the most important parts of the table . Make sure the table can be understood by itself without the accompanying text; however, it is never independent of the text. There must be a reference in the text to the table . Construction of the table table is an example of an APA table for displaying simple descriptive data collected in a study. It also appears in correct relation to the text of the document; that is, it is inserted below the place that the table is first mentioned either on the same page, if it will fit, or the next page. (Fig.)
7 Shows the same table with the table parts identified.) The major parts of a table are the number, the title, the headings, the body, and the notes. table An Example of a table in APA Format for Displaying Simple Descriptive Data table 1. Means and Standard Deviations on the Measure of Self-Direction in Learning as a Function of Age in Adult Students Self-directed learning inventory score Age group n M SD. 20 34 15 65 35 40 22 88 50 64 14 79 65 79 7 56 80+ --a -- -- Note. The maximum score is 100. a No participants were found for the over 80 group. table Numbering Arabic numerals are used to number Tables in the order in which they appear in the text.
8 Do NOT. write in the text the table on page 17 or the table above or below. The correct method would be to refer to the table number like this: (see table 1) or table 1 shows Left-justify the table number (see table ). In an article, each table should be numbered sequentially in the order of appearance. Do not use suffix letters or numbers with the table numbers in articles. However, in a book, Tables may be numbered within chapters; for example, table If the table appears in an appendix, identify it with the letter of the appendix capitalized, followed by the table number; for instance, table is the third table in Appendix C.
9 table Titles Include the variables, the groups on whom the data were collected, the subgroups, and the nature of the statistic reported. The table title and headings should concisely describe what is contained Making Tables AND Figures 201. in the table . Abbreviations that appear in the body of the table can sometimes be explained in the title; however, it may be more appropriate to use a general note (see also comments on table Headings). The title must be italicized. Standard APA format for journal submission requires double spacing throughout. However, Tables in student papers may be partially single spaced for better presentation.
10 table Number Title table 1. Means and Standard Deviations on the Measure of Self-Direction in Learning as a Function of Age in Adult Students Stub Inventory score Column Spanner Colu mn Age group n M SD Headings 20-34 15 65 35-40 22 88 Cell Use horizontal 50-64 14 79 lines under 65-79 7 56 the title, Body 80+ --a -- -- headings, and the body, but no vertical Note. The maximum score is 100. lines. a No participants were found for the over 80 group. Notes Fig. The major parts of an APA table . table Headings Headings are used to explain the organization of the table .