Transcription of MATLAB for image processing --- A guide to basic MATLAB ...
1 1 MATLAB for image processing --- A guide to basic MATLAB functions for image processing with MATLAB exercises Yao Wang and Fanyi Duanmu Tandon School of Engineering, New York University Jan. 2016 I Learn about generic tools in MATLAB for image processing Finding MATLAB functions for image processing To determine if the image processing Toolbox is already installed on your system, and all the functions provided by the toolbox, type: help images at the MATLAB prompt. If the toolbox is installed, MATLAB responds with a list of image processing functions. if it doesn t, tell your lab assistant so that the problem can be corrected. Importing and Exporting Images Before moving ahead with any image processing operations we need to discuss the process of importing and exporting images to/from the MATLAB environment.
2 MATLAB supports several image file formats, including JPEG (JPG), TIFF,BMP, etc. You can use IMREAD to read in any image file with a supported format. Use help imread to find out more details. To read a gray scale or true color image in one of the supported format, you use [A] = IMREAD(FILENAME,FMT) which will read the image data in FILENAME into a matrix A. If the image file contains a gray scale image , then A is a 2D matrix. If the file contains a RGB color image , then A is a 3D matrix. For example, if you have a color image in JPEG format, , with size MxN then using [A]=IMREAD( , JPG ) will create a MxNx3 matrix A, with A(1:M,1:N,1) storing the red component, A(1:M,1:N,2) the green component, and A(1:M,1:N,3) the blue component.
3 If the image is in an indexed format, then use 2 [A,MAP] = IMREAD(FILENAME,FMT) A will store the index image , and MAP will store the colormap. The function IMWRITE allows you to write an image saved in a data matrix to a file with a specified format. For example, IMWRITE(A, , JPG ) will save the image data A in a file using the JPEG compression format. Use help IMWRITE to find more details. Displaying Images The function imshow displays any supported image . For indexed images, imshow installs the image into the current axes using a specified colormap: imshow(X, map) With no colormap name, imshow uses the current colormap. For the purpose of web publishing we always deal with indexed color images. We have provided 3 files (JPG, BMP, TIFF) for you to read and Display using MATLAB .
4 You are also welcome to use any image of your own. You must read, display and write an image of each format and become familiar with the process. To enable you to read and display a gray scale image saved in the raw format, , it contains the pixel value sequentially row by row, with one byte/pixel, a MATLAB script h:\el593\exp5\ is provided. For example, to read the raw image , you can use show( ,512,512) II Experiment MATLAB Warm-up Exercises ( basic image I/O and Matrix Manipulation) Read and display a color image . Use help to understand how imread and imshow works. Read in an RGB image , and display it using imshow. Using the Data cursor tool under Tools in the display window, pick a few points and find out their location and R,G,B values.
5 Read in the index map image , , save both the index image and the colormap, and display it using imshow. Using the tools->Data cursor tool, pick a few points and find out their location and R,G,B values. What are the RGB values reported for pixels that are in the red, green, blue, magenta, yellow, cyan, and white regions? Sample Code as follows: [Matrix Map] = imread(' '); 3 imshow(Matrix, Map); Stitching up multiple images using provided programs In this task, you should go through the following sample program , which read in 4 color images, put them into another big image , display and save the resulting image . This example program serves to help you familiarize with the basic MATLAB tools for image I/O and submatrix access. Please apply this program to any 4 images you may have, or use the provided sample images.
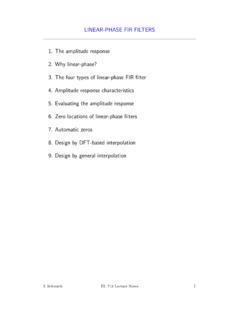
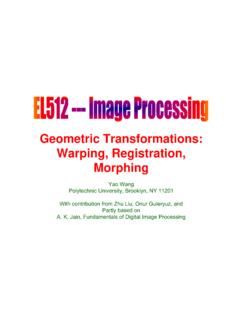
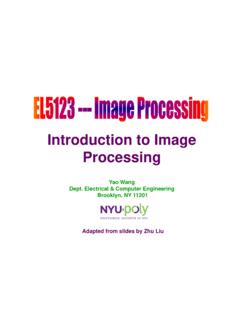
6 Sample Code as follows: % Read in input sub-images ul = imread(' '); ur = imread(' '); ll = imread(' '); lr = imread(' '); % Initialize a image buffer for final stitched image . [Row Col Layer] = size(ul); Output = zeros(Row * 2, Col * 2, Layer); % Fill in four quadrants with sub-images (by assigning temporary matrices to target area of final image ). Output(1:Row,1:Row,:) = ul; Output(1:Row,Row+1:2*Row,:) = ur; Output(Row+1:2*Row,1:Row,:) = ll; Output(Row+1:2*Row,Row+1:2*Row,:) = lr; % Display Sub-images and Stitched image subplot(2,2,1); imshow(ul); subplot(2,2,2); imshow(ur); subplot(2,2,3); imshow(ll); subplot(2,2,4); imshow(lr); figure; imshow(uint8(Output));title('Stitched image '); % Save the final stitched image as a " " file for later use.
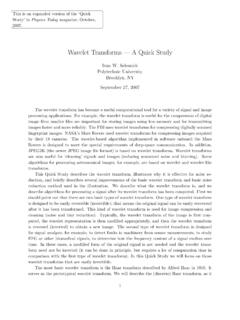
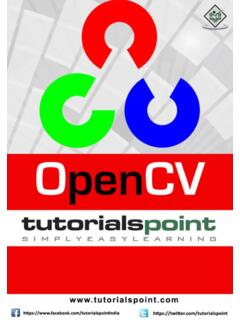
7 Imwrite(Output, ' '); 4 Fig 1 Input Sub-Images Fig 2 Output Stitched image Creating a jigsaw version of an original image Sample Code as follows: % Read in image Input = imread(' '); % Get Height, Width and Component Number [Row Col Layer] = size(Input); % Row = Col = 512, Layer = 3 -> RGB 5 % Calculate Patch Size Sub_Image_Height = Row / 4; Sub_Image_Width = Col / 4; % Create Output Buffer, which is initialized the same as input Output = Input; % Misplace some patches % For simplicity, I move the lower right corner to upper left corner % You may do something different Output(1:Sub_Image_Height,1:Sub_Image_Wi dth,:) = Input (Row-Sub_Image_Height+1:Row,Col-Sub_Imag e_Width+1:Col,:); Output(Row-Sub_Image_Height+1:Row,Col-Su b_Image_Width+1:Col,:) = Input(1:Sub_Image_Height,1:Sub_Image_Wid th,:); % Display Output Jigsaw image imshow(Output); % Save Output image imwrite(Output, ' '); % Sometimes your input signal is not between 0 and 255, say, between 0 and 1 or 0 and 512, You may scale your input to 0-255 and then display it.
8 Sample code as follows Pixel_max = max(max(Input)); % Find extreme value in your image Output = floor(Input * 255 / Pixel_max);% Scale Input Signal onto 0-255 6 Fig 3 Output JigSaw image by Interchanging Two image Patches image grayscale manipulation Write a program which does the following: 1) read in a color image ; 2) Generate a grayscale version of an original RGB image (you can use rgb2gray( ) function of MATLAB ); 3) Generate an inverted grayscale image . This can be done by using Img2=255-Img1, if Img1 is a gray scale image in the range o 0-255. 4) Create a binary (black and white) image by thresholding the original grayscale image using a prescribed threshold T so that an original gray value V is change to 0 if V is below T, and is changed to 255 if V is above T.
9 Hint: The last step can be easily accomplished in MATLAB by Bimg = (Img > T)*255; Color model conversion RGB to YCbCr Conversion In this part, you should write a program for converting an input image in RGB color model to an image in using the YCbCr model. The program should have the following steps: 1) read in an RGB image based on the given filename and save the image data in a matrix. 2) Display the color image directly, as well display the individual red, green, and blue channels as gray scale image . 3) Call your own function myrgb2ycbcr( ). It should have the syntax: YCCimg=myrgb2ycbcr(RGBimg) 4) Display the Y, Cb, and Cr channels as grayscale images. 5) Call you own function myycbcr2rgb( ). It should have the syntax: RGBimg=myycbcr2rgb2(YCCimg) 6) Display the resulting RGBimg and compare with the original color image .
10 7 You should write your own functions YCCimg=myrgb2ycbcr(RGBimg) and RGBimg=myycbcr2rgb2(YCCimg). Your function YCCimg=myrgb2ycbcr(RGBimg) may look something like the following: YCCimg=myrgb2ycbcr(RGBimg) Rimg=RGBimg(:,:,1); Gimg=.. Bimg=.. Yimg=zeros( ..); Cbimg=.. Crimg=.. Yimg=floor( *Rimg+ *Gimg+ *Bimg+16); Cbimg=.. Crimg=.. YCCimg = zeros(size(RGBimg)); YCCimg(:,:,1) = Yimg; YCCimg(:,:,2) = Cbimg; YCCimg(:,:,3) = Crimg; Note that you do not look through each pixel. Because the operation for each pixel is the same, you can take advantage MATLAB s built-in capability to do arithmetic on the matrices directly. To see how much time you save, please also run another version of the program, which change the shaded lines in the previous example to (height,width)=size(Rimg); For (i=1:height, j=1:width) Yimg(I,j_) =floor( *Rimg(I,j)+ *Gimg(I,j)+ *Bimg(I,j)+16); Cbimg(I,j)=.