Transcription of May 2018 I BOND RATE CHART - TreasuryDirect - …
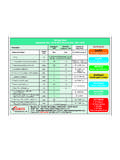
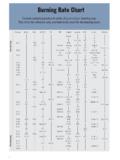
1 SERIES I SAVINGS bond EARNINGS rates EFFECTIVE MAY 1, 2020 Issue DateFixed RateMay-20 Nov-19 May-19 Nov-18 May-18 Nov-17 May-17 Nov-16 May-16 Nov-15 May-15 Nov-14 May-14 Nov-13 May-13 Nov-12 May-12 Nov-11 May-11 Nov-10 May-10 Nov-09 May-09 Nov-08 May-08 Nov-07 May-07 Nov-06 May-06 Nov-05 May-05 Nov-04 May-04 Nov-03 May-03 Nov-02 May-02 Nov-01 May-01 Nov-00 May-00 Nov-99 May-99 Nov-98 Sep-9805/20 - 10 - 04 - 10 - 04 - 10 - 04 - 10.
2 04 - 10 - 04 - 10 - 04 - 10 - 04 - 10 - 04 - 10 - 04 - 10 - 04 - 10 - 04 - 10 - 04 - 10 - 04 - 10 - 04 - 10 - 04 - 10 - 04 - 10 - 04 - 10 - 04 - 10 - 04 - 10 - 04 - 10 - 04 - 10 - 04 - 10 Inflation CHART shows all fixed rates , inflation rates , and composite rates for all Series I savings bonds rates for your bond by locating its issue date in the far left column. Then .. --The fixed rate is in the next column to the right --The composite rate for each six-month interest period appears across the table, from left to right, beginning in the column to the right of the column for fixed rates --The inflation rate for each six-month interest period appears on the bottom row of the tableMore information: --How is the composite rate determined?
3 --When do the inflation rate and composite rate for my bond change?