Transcription of mcs2020.pdf - Mineral Commodity Summaries 2020 - USGS
1 Department of the Geological SurveyMINERAL Commodity Summaries 2020 SiliconSilverSoda AshStoneStrontiumSulfurTalcTantalumTellu riumThalliumThoriumTinTitaniumTungstenVa nadiumVermiculiteWollastoniteYttriumZeol itesZincZirconiumMercuryMicaMolybdenumNi ckelNiobiumNitrogenPalladiumPeatPerliteP hosphate RockPlatinumPotashPumiceQuartz CrystalRare EarthsRheniumRubidiumSaltSand and GravelScandiumSeleniumFluorsparGalliumGa rnetGemstonesGermaniumGoldGraphiteGypsum HafniumHeliumIndiumIodineIron and SteelIron OreIron Oxide PigmentsKyaniteLeadLimeLithiumMagnesiumM anganeseAbrasivesAluminumAntimonyArsenic AsbestosBariteBauxiteBerylliumBismuthBor onBromineCadmiumCementCesiumChromiumClay sCobaltCopperDiamondDiatomiteFeldspar Cover: Minerals play an integral part in all aspects of our lives. In this rural setting, minerals provide nutrients, such as nitrogen, phosphorus, potassium, and a host of micronutrients essential to maximize crop yields to ensure reliable food supplies.
2 Various metals and other Mineral materials are required to build the harvesters shown, in addition to the equipment needed to prepare the fields for and to plant these crops. Open spaces are ideal for wind farms, comprising myriad wind turbines that require numerous Mineral materials for the actual structures as well as the infrastructure to transmit the electrical power produced to consumers across the nation. (Image provided as a courtesy of John Deere.) Department of the Interior Geological Survey Mineral Commodity Summaries 2020 Abrasives Fluorspar Mercury Silicon Aluminum Gallium Mica Silver Antimony Garnet Molybdenum Soda Ash Arsenic Gemstones Nickel Stone Asbestos Germanium Niobium Strontium Barite Gold Nitrogen Sulfur Bauxite Graphite Palladium Talc Beryllium Gypsum Peat Tantalum Bismuth Hafnium Perlite Tellurium Boron Helium Phosphate Rock Thallium Bromine Indium Platinum Thorium Cadmium Iodine Potash Tin Cement Iron and Steel Pumice Titanium Cesium Iron Ore Quartz Crystal Tungsten Chromium Iron Oxide Pigments Rare Earths Vanadium Clays Kyanite Rhenium Vermiculite cobalt Lead Rubidium Wollastonite copper Lime Salt Yttrium Diamond Lithium Sand and Gravel Zeolites Diatomite Magnesium Scandium Zinc Feldspar Manganese Selenium Zirconium Department of the Interior DAVID BERNHARDT, Secretary Geological Survey James F.
3 Reilly II, Director Geological Survey, Reston, Virginia: 2020 Manuscript approved for publication January 31, more information on the USGS the Federal source for science about the Earth, its natural and living resources, natural hazards, and the environment visit https: or call 1 888 ASK USGS. For an overview of USGS information products, including maps, imagery, and publications, visit For sale by the Superintendent of Documents, Government Publishing Office Mail: Stop IDCC; Washington, DC 20402 0001 Phone: (866) 512 1800 (toll-free); (202) 512 1800 (Washington, DC area) Fax: (202) 512 2104 Internet: Email: Any use of trade, product, or firm names is for descriptive purposes only and does not imply endorsement by the Government. Although this report is i n the public domain, permission must be secured from the individual copyright owners to reproduce any copyrighted material contained within this report. Suggested citation: Geological Survey, 2020, Mineral Commodity Summaries 2020: Geological Survey, 200 p.
4 , ISBN 978-1-4113-4362-71 CONTENTS Page Page General: Introduction .. 3 The Role of Nonfuel Minerals in the Economy .. 4 Significant Events, Trends, and Issues .. 5 2019 Net Import Reliance .. 7 Major Import Sources of Nonfuel Mineral Commodities in 2019 .. 8 Table 1 Mineral Industry Trends .. 9 Table 2 Mineral -Related Economic Trends .. 9 Table 3 Value of Nonfuel Mineral Production in the United States in 2019 .. 10 Appendix A Abbreviations and Units of Measure .. 194 Appendix B Definitions of Selected Terms Used In This Report .. 194 Appendix C Reserves and Resources .. 195 Appendix D Country Specialists Directory .. 199 Mineral Commodities: Abrasives (Manufactured) .. 18 Aluminum .. 20 Antimony .. 22 Arsenic .. 24 Asbestos .. 26 Barite .. 28 Bauxite and Alumina .. 30 Beryllium .. 32 Bismuth .. 34 Boron .. 36 Bromine .. 38 Cadmium .. 40 42 Cesium .. 44 46 Clays .. 48 cobalt .. 50 copper .. 52 Diamond (Industrial) .. 54 Diatomite .. 56 Feldspar and Nepheline Syenite.
5 58 Fluorspar .. 60 Gallium .. 62 Garnet (Industrial) .. 64 Gemstones .. 66 Germanium .. 68 Gold .. 70 Graphite (Natural) .. 72 Gypsum .. 74 Helium .. 76 Indium .. 78 Iodine .. 80 Iron and Steel .. 82 Iron and Steel Scrap .. 84 Iron and Steel Slag .. 86 Iron Ore .. 88 Iron Oxide Pigments .. 90 Kyanite and Related Minerals .. 92 Lead .. 94 Lime .. 96 98 Magnesium Compounds .. 100 Magnesium Metal .. 102 Manganese .. 104 Mercury .. 106 Mica (Natural) .. 108 Molybdenum .. 110 Nickel .. 112 Niobium (Columbium) .. 114 Nitrogen (Fixed) Ammonia .. 116 Peat .. 118 Perlite .. 120 Phosphate Rock .. 122 Platinum-Group Metals .. 124 Potash .. 126 Pumice and Pumicite .. 128 Quartz Crystal (Industrial) .. 130 Rare Earths .. 132 Rhenium .. 134 Rubidium .. 136 Salt .. 138 Sand and Gravel (Construction) .. 140 Sand and Gravel (Industrial) .. 142 Scandium .. 144 Selenium .. 146 Silicon .. 148 Silver .. 150 Soda Ash .. 152 Stone (Crushed) .. 154 Stone (Dimension) .. 156 Strontium .. 158 Sulfur.
6 160 Talc and Pyrophyllite .. 162 Tantalum .. 164 Tellurium .. 166 Thallium .. 168 Thorium .. 170 Tin .. 172 Titanium and Titanium Dioxide .. 174 Titanium Mineral Concentrates .. 176 Tungsten .. 178 Vanadium .. 180 Vermiculite .. 182 Wollastonite .. 184 Yttrium .. 186 Zeolites (Natural) .. 188 Zinc .. 190 Zirconium and Hafnium .. 1922 INSTANT INFORMATION Information about the Geological Survey, its programs, staff, and products is available from the internet at or by calling (888) ASK USGS [(888) 275 8747]. This publication has been prepared by the National Minerals Information Center. Information about the Center and its products is available from the internet at or by writing to Director, National Minerals Information Center, 988 National Center, Reston, VA 20192. KEY PUBLICATIONS Minerals Yearbook These annual publications review the Mineral industries of the United States and of more than 180 other countries. They contain statistical data on minerals and materials and include information on economic and technical trends and developments and are available at The three volumes that make up the Minerals Yearbook are Volume I, Metals and Minerals; Volume II, Area Reports, Domestic; and Volume III, Area Reports, International.
7 Mineral Commodity Summaries Published on an annual basis, this report is the earliest Government publication to furnish estimates covering nonfuel Mineral industry data and is available at Data sheets contain information on the domestic industry structure, Government programs, tariffs, and 5-year salient statistics for more than 90 individual minerals and materials. Mineral Industry Surveys These periodic statistical and economic reports are designed to provide timely statistical data on production, shipments, stocks, and consumption of significant Mineral commodities and are available at The surveys are issued monthly, quarterly, or at other regular intervals. Materials Flow Studies These publications describe the flow of minerals and materials from extraction to ultimate disposition to help better understand the economy, manage the use of natural resources, and protect the environment and are available at Recycling Reports These studies illustrate the recycling of metal commodities and identify recycling trends and are available at Historical Statistics for Mineral and Material Commodities in the United States (Data Series 140) This report provides a compilation of statistics on production, trade, and use of approximately 90 Mineral commodities since as far back as 1900 and is available at WHERE TO OBTAIN PUBLICATIONS Mineral Commodity Summaries and the Minerals Yearbook are sold by the Government Publishing Office.
8 Orders are accepted over the internet at , by email at by telephone toll free (866) 512 1800; Washington, DC area (202) 512 1800, by fax (202) 512 2104, or through the mail ( Box 979050, St. Louis, MO 63197 9000). All current and many past publications are available in PDF format (and some are available in XLS format) through 3 INTRODUCTION Each chapter of the 2020 edition of the Geological Survey (USGS) Mineral Commodity Summaries (MCS) includes information on events, trends, and issues for each Mineral Commodity as well as discussions and tabular presentations on domestic industry structure, Government programs, tariffs, 5-year salient statistics, and world production and resources. The MCS is the earliest comprehensive source of 2019 Mineral production data for the world. More than 90 individual minerals and materials are covered by two-page synopses. For Mineral commodities for which there is a Government stockpile, detailed information concerning the stockpile status is included in the two-page synopsis.
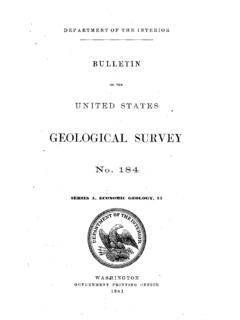
9 Abbreviations and units of measure and definitions of selected terms used in the report are in Appendix A and Appendix B, respectively. Appendix C Reserves and Resources includes Part A Resource/Reserve Classification for Minerals and Part B Sources of Reserves Data. A directory of USGS minerals information country specialists and their responsibilities is Appendix D. The USGS continually strives to improve the value of its publications to users. Constructive comments and suggestions by readers of the MCS 2020 are welcomed. THE ROLE OF NONFUEL MINERALS IN THE ECONOMY(ESTIMATED VALUES IN 2019)NET EXPORTS OF MINERALRAW MATERIALSGOLD, SODA ASH, ZINC CONCENTRATES, : $ billionImports: $ billionNet exports: $ billionDOMESTIC Mineral RAW MATERIALS FROM MININGCOPPER ORES, IRON ORE, SAND AND GRAVEL, STONE, : $ billionMETALS AND Mineral PRODUCTS RECYCLED DOMESTICALLYALUMINUM, GLASS, STEEL, of old scrap: $ billionNET EXPORTS OF OLD SCRAPGOLD, STEEL, : $ billionImports: $ billionNet exports: $ billionMINERAL MATERIALS PROCESSED DOMESTICALLYALUMINUM, BRICK, CEMENT, copper , FERTILIZERS, STEEL, of shipments: $770 billionNET IMPORTS OF PROCESSED Mineral MATERIALSMETALS, CHEMICALS, : $139 billionExports: $86 billionNet imports: $53 billionSources: Geological Survey and the Department of consuming industries of processed Mineral materials are construction, durable goods manufacturers, and some nondurable goods manufacturers.
10 The value of shipments for processed Mineral materials cannot be directly related to gross domestic ECONOMYG ross Domestic Product: $21,429 billionVALUE ADDED TO GROSS DOMESTIC PRODUCT BY MAJOR INDUSTRIES THAT CONSUME PROCESSED Mineral MATERIALS1 Value: $3,130 billion45 SIGNIFICANT EVENTS, TRENDS, AND ISSUES In 2019, the estimated total value of nonfuel Mineral production in the United States was $ billion, an increase of 3% from the revised total of $84 billion in 2018. The estimated value of metals production increased slightly to $ billion. Lower production of some metals was offset by increased values. Byproduct vanadium was produced in Utah for the first time since 2013. The total value of industrial minerals production was $ billion, a 3% increase from that of 2018. Of this total, $ billion was construction aggregates production (construction sand and gravel and crushed stone). Crushed stone was the leading nonfuel Mineral Commodity in 2019 accounting for 22% of the total value of nonfuel Mineral production.