Transcription of Measuring digital development Facts and Þgures
1 ITUP ublicationsMeasuring digital developmentFacts and figures 2020 International Telecommunication UnionDevelopment SectorPage 2 Facts and Figures 2020 This new edition of Measuring digital development : Facts and Figures comes at an extraordinarilychallenging time for the international community. With the COVID-19 pandemic wreaking havoc on lives,societies and economies around the world, many of our daily activities have moved online, throwing a sharpspotlight on global connectivity. If you are reading this, it means you are online but what about the billions ofpeople still not fortunate enough to be able to connect? Facts and Figures 2020 reveals that people in rural areas continue to face greater challenges than people inurban areas in terms of remaining connected during the lockdown, especially in developing economies.
2 Largeswathes of the rural landscape are still not covered by mobile broadband networks, and fewer households inthese areas have access to the worrying, the rollout of communications infrastructure is slowing. Since growth in communicationsinfrastructure deployment was already showing signs of slowing in 2019, it is still too early to tell whethergrowth has stalled because of the pandemic, or whether there are other factors at new edition of Facts and Figures also finds that mobile cellular subscriptions have been declining for thefirst time in history, and that growth in mobile broadband subscriptions is levelling out. Here, as before, it isnot certain if this a result of the COVID-19 crisis: it will be interesting to see what happens once the worldfinally reverts to a more normal state of a more optimistic note, our research confirms that, where connectivity is available, and affordable, youngpeople are enthusiastic adopters of technology and have relatively high levels of Internet use.
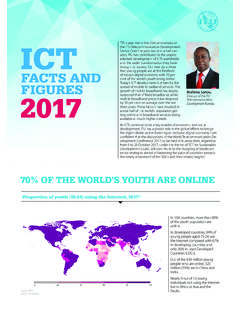
3 While overalljust over half of the global population is using the Internet, among young people aged 15 to 24 this rises toalmost 70 per cent. This is particularly encouraging in view of the fast-growing youth demographic in much ofthe developing world, where digital technologies have the potential to become a major accelerator ofeconomic growth and development and an important driver of progress towards the 17 SustainableDevelopment am particularly pleased that, for the first time, this new edition of Facts and Figures contains statistics onSmall Island Developing States (SIDS) and Landlocked Developing Countries (LLDCs), in addition to our dataon the 47 UN-designated Least Developed Countries (LDCs).
4 This important new edition, released at a time of unprecedented global uncertainty, explores what we knowand can predict about those connected and those not connected but with some reservations. Under normalcircumstances, ITU s expert team of statisticians uses the data submitted by Member States for the previousyear to make predictions for the current year. However, with COVID-19 profoundly changing the use of digitaldevices and services, past trends are less useful for predicting present or future phenomena (see Methodology for more details).Nevertheless, progress made prior to the pandemic will have influenced how well-prepared different parts ofthe world have been to face the challenges posed by COVID-19 and its associated disruptions to normal life,including the challenge of switching from physical to digital .
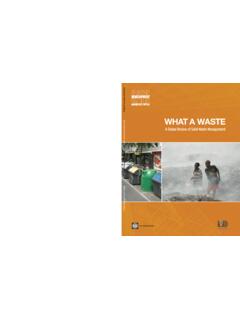
5 In the current context, this edition of Facts andFigures presents a mix of findings on digital readiness and resilience that offer a new perspective on theimpact and importance of connectivity to every nation s Bogdan-MartinDirector, ITU Telecommunication development BureauForewordPage 3 Facts and Figures 2020 ContentsPage 2 ForewordPage 3 ContentsPage 4 Mobile networkcoveragePage 5 Network CoverageRural/UrbanPage 6 Household accessto ICTsPage 7-8 Internet usePage 9 Mobile & fixedsubscriptionsPage 10 InternationalbandwidthPage 11 Mobile phoneownershipPage 12 ICT skillsPage 13 ICT affordabilityPage 14-15 The impact ofCovid-19 Page 16-17 MethodologyPage 4 Facts and Figures 2020 Rollout of mobile-broadbandnetworks slowing down in 20200%20%40%60%80%100%WorldAfricaArab StatesAsia & PacificCISE uropeThe AmericasDevelopedDevelopingLDCsLLDCsSIDS 4G ( )4G ( )4G ( )4G ( )4G ( )
6 4G ( )4G ( )4G ( )4G ( )4G ( )4G ( )4G ( )3G ( )3G ( )3G ( )3G ( )3G ( )2G ( )2G ( )2G ( )3G ( )3G ( )3G ( )2G ( )Population coverage by type of mobile network, 2020*201520162017201820192020*0%20%40%60 %80%100%2G3G4 GGlobally, almost 85 per cent of thepopulation will be covered by a 4 Gnetwork at the end of 2015 and 2020, 4G networkcoverage increased two-fold growth has been slowing downgradually since 2017, and 2020coverage is only percentage pointshigher than per cent of the worldpopulation has access to amobile-broadband network, less thanhalf a percentage point higher than ayear most regions, more than 90 per cent of the population has access to a mobile-broadband network (3G or above).
7 Africa and CIS are the regions facing the biggest gap, where respectively 23 and 11 per cent of the population have no access to a 2020, Africa achieved 21 per cent growth in 4G rollout, while growth was negligible in all the other a quarter of the population in LDCs and LLDCs, and about 15 per cent of the SIDS population do not have access to a mobile-broadbandnetwork, coming short of SDG Target to significantly increase access to information and communications technology and strive to provideuniversal and affordable access to the Internet in least developed countries by 2020.* ITU estimate. Source: ITUNote: The values for 2G and 3G networks show the incremental percentage of population that is not covered by a more advanced technology network ( the world population is covered by a 3G network, that is + ).
8 Population coverage by type of mobile network, 2015-2020** ITU estimate. Source: ITUPage 5 Facts and Figures 2020 Mobile-broadband network coverage: Developingcountries rural areas still penalized* ITU estimate. Source: ITUW orldRuralUrbanAfricaRuralUrbanArab StatesRuralUrbanAsia & PacificRuralUrbanCISR uralUrbanEuropeRuralUrbanThe AmericasRuralUrbanDevelopedRuralUrbanDev elopingRuralUrbanLDCsRuralUrbanLLDCsRura lUrbanSIDSR uralUrban3G (13%)4G (71%)4G (95%)2G (8%)2G (18%)3G (40%)3G (23%)4G (22%)4G (77%)2G (10%)3G (34%)3G (24%)4G (44%)4G (76%)4G (100%)4G (89%)4G (100%)2G (29%)3G (22%)4G (44%)4G (100%)4G (89%)3G (24%)4G (54%)4G (98%)4G (100%)4G (86%)2G (9%)3G (14%)4G (70%)4G (94%)2G (7%)2G (19%)3G (37%)3G (32%)4G (27%)4G (67%)2G (27%)3G (39%)3G (15%)4G (25%)4G (84%)3G (31%)3G (21%)4G (35%)4G (77%)
9 Population coverage by type of mobile network and area, 2020*While virtually all urban areas in the world are covered by a mobile-broadband network, many gaps subsist in rural LDCs, 17 per cent of the rural population has no mobile coverage at all, and 19 per cent of the rural population is only covered by a 2G 6 Facts and Figures 2020 Internet access at home in urban areastwice as high as in rural areasA similar picture emerges for households with a computer, butsince computers are no longer the main gateway to the Internet,across the board the percentage of households with a computeris smaller than the percentage of households with urban-rural gap is bigger though in household computeraccess than in Internet of households with Internet access at home and with a computer, 2005-2019*Internet accessWorldAfricaArab StatesAsia & PacificCISE uropeThe AmericasDevelopedDevelopingLDCsLLDCsRura l - 37%Urban - 72% 6% 28% 38% 74% 36% 70% 66% 81% 78% 88% 50% 74% 81% 87% 28% 65% 10% 25% 14% 46%Globally, about 72 per cent of households in urban areas had access to theInternet at home in 2019, almost twice as much as in rural areas (nearly 38 percent).
10 The urban-rural gap was small in developed countries, but in developing countriesurban access to the Internet was times as high as rural Africa, only 28 per cent of households in urban areas had access to the Internetat home, but that was still times as high as the percentage in rural areas,which stood at per the other regions of the world, household Internet access in urban areas stoodbetween 70 and 88 per cent, while access in rural areas ranged between 37 and78 per of households with computer and/or Internet access at home, 2019*Computer accessRural - 25%Urban - 63% 2% 17% 34% 67% 22% 60% 50% 72% 66% 82% 34% 67% 66% 84% 17% 54% 3% 17% 8% 37%* ITU estimateNote: Insufficient data available to produce estimates for : ITU2005200620072008200920102011201220132 01420152016201720182019*0%10%20%30%40%50 %60% 57% 47%Households with a computer, 2019*Households with Internet access at home, 2019** ITU estimate.