Transcription of Measuring student satisfaction - ed
1 NATIONAL CENTRE FOR VOCATIONAL EDUCATION RESEARCH TECHNICAL PAPERM easuring student satisfaction from the student Outcomes SurveyPeter FiegerNATIONAL CENTRE FOR VOCATIONAL EDUCATION RESEARCH Measuring student satisfaction from the student Outcomes Survey Peter Fieger National Centre for Vocational Education Research The views and opinions expressed in this document are those of the author/project team and do not necessarily reflect the views of the Australian Government or state and territory governments. NATIONAL CENTRE FOR VOCATIONAL EDUCATION RESEARCH TECHNICAL PAPER Commonwealth of Australia, 2012 With the exception of the Commonwealth Coat of Arms, the Department s logo, any material protected by a trade mark and where otherwise noted all material presented in this document is provided under a Creative Commons Attribution Australia < > licence.
2 The details of the relevant licence conditions are available on the Creative Commons website (accessible using the links provided) as is the full legal code for the CC BY AU licence < >. The Creative Commons licence conditions do not apply to all logos, graphic design, artwork and photographs. Requests and enquiries concerning other reproduction and rights should be directed to the National Centre for Vocational Education Research (NCVER). This document should be attributed as Fieger, P 2012, Measuring student satisfaction from the student Outcomes Survey, NCVER, Adelaide. This work has been produced by NCVER on behalf of the Australian Government, and state and territory governments, with funding provided through the Department of Industry, Innovation, Science, Research and Tertiary Education. The views and opinions expressed in this document are those of NCVER and do not necessarily reflect the views of the Australian Government or state and territory governments.
3 ISBN 978 1 922056 06 1 TD/TNC Published by NCVER ABN 87 007 967 311 Level 11, 33 King William Street, Adelaide, SA 5000 PO Box 8288 Station Arcade, Adelaide SA 5000, Australia ph +61 8 8230 8400 fax +61 8 8212 3436 About the research Measuring student satisfaction from the student Outcomes Survey Peter Fieger, National Centre for Vocational Education Research The student Outcomes Survey is an annual national survey of vocational education and training (VET) students . Since 1995, participants have been asked to rate their satisfaction with different aspects of their training, grouped under three main themes: teaching, assessment, and generic skills and learning experiences. While the composition of the bank of satisfaction questions has remained fairly constant over time and the suitability of the three overarching satisfaction categories has been validated statistically on several occasions, little progress has been made on creating summary measures that encapsulate the three main themes of student satisfaction .
4 Such summary measures would be much more useful to researchers than responses to the bank of 19 satisfaction questions, which are very detailed. This paper compares three methods of creating a composite score and evaluates their statistical veracity. Key messages The grouping of satisfaction questions into themes of teaching, assessment, and generic skills and learning experiences remains statistically valid in the current student Outcomes Survey. A composite score for questions under these three main themes is needed to facilitate post-survey analytical studies. We review and compare three different methods of creating summary measures in respect of their utility. These methods are Rasch analysis, weighted means and simple means. We find that all three methods yield similar results and so recommend using the simple means method to create the summary measures.
5 Tom Karmel Managing Director, NCVER NCVER 5 Contents Tables and figures 6 Introduction 7 satisfaction themes 9 Comparison of composite measures 12 Rasch analysis 12 Simple averages 13 Weighted averages 13 Evaluation/best fit 13 Conclusion 16 References 17 6 Measuring student satisfaction from the student Outcomes Survey Tables and figures Tables 1 Eigenvalues of the correlation matrix (abridged) 9 2 Factor loadings after transformation using varimax rotation 11 3 Descriptive statistics and coefficients of reliability 12 4 Descriptive statistics of composite scores 14 5 Comparison teaching composite scores 14 6 Comparison assessment composite scores 14 7 Comparison generic skills and learning composite scores 14 Figures 1 student satisfaction items in the student Outcomes Survey 8 2 Eigenvalues based on parallel analysis 10 NCVER 7 Introduction The student Outcomes Survey is an annual national survey of vocational education and training (VET) students .
6 The survey aims to gather information on students , including their employment situation, their reasons for undertaking the training, the relevance of their training to their employment, any further study aspirations, reasons for not undertaking further training and satisfaction with their training experience. The survey is aimed at students who have completed a qualification (graduates) or who successfully completed part of a course and then leave the VET system (module completers). The assessment of student satisfaction with their training consists of 19 individual questions and one summary question (see figure 1). The teaching and learning questions are based on questions asked in the Higher Education Course Experience Survey, and the generic skills and learning experience questions are based on questions developed by Western Australia as part of the VET student survey (Bontempo & Morgan 2001).
7 These questions occupy a significant portion of the questionnaire (20 out of 56 questions). To date the focus has been on reporting only the overall satisfaction item. Use of the individual satisfaction questions has been limited, mainly due to their specificity, narrow scope and number of measures. The individual satisfaction questions are grouped under three themes: teaching, assessment, and generic skills and learning experiences. While there has been some initial statistical validation of these three groupings, no significant recent analysis has been undertaken, and no summary measure of the constituent questions has been devised. It is the purpose of this paper to validate statistically the grouping of the satisfaction questions in the context of current surveys and to develop a summary measure for each of the three themes to make the data more accessible.
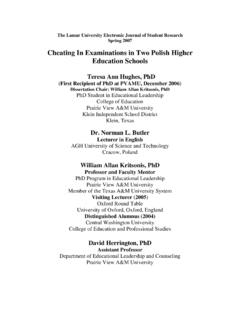
8 We use principal component analysis to identify the underlying dimensions of the 19 satisfaction items and group the questions accordingly. Cronbach s alpha scores are calculated to assess the internal consistency of the resulting groups. We then use three different approaches to derive composite scores to represent the groups created: Rasch analysis, weighted composite averages and straight Finally, we determine the extent to which the newly established composite scores differ and which ones would be most useful in future research and reporting. 1 Further explanation of these methods is found on pages 11 and 12. 8 Measuring student satisfaction from the student Outcomes Survey Figure 1 student satisfaction items in the student Outcomes Survey Strongly disagreeDisagreeNeither agree nor disagreeAgree Strongly agree Not applicableTeaching 1 My instructors had a thorough knowledge of the subject content 2 My instructors provided opportunities to ask questions 3 My instructors treated me with respect 4 My instructors understood my learning needs 5 My instructors communicated the subject content effectively 6 My instructors made the subject as interesting as possible Assessment 7 I knew how I was going to be assessed 8 The way I was assessed was a fair test of my skills
9 9 I was assessed at appropriate intervals 10 I received useful feedback on my assessment 11 The assessment was a good test of what I was taught Generic skills and learning experiences 12 My training developed my problem-solving skills 13 My training helped me develop my ability to work as a team member 14 My training improved my skills in written communication 15 My training helped me to develop the ability to plan my own work 16 As a result of my training, I feel more confident about tackling unfamiliar problems 17 My training has made me more confident about my ability to learn 18 As a result of my training, I am more positive about achieving my goals 19 My training has helped me think about new opportunities in life Overall satisfaction with the training How would you rate, on average, your satisfaction with the overall quality of the training?
10 20 Overall, I was satisfied with the quality of this training Source: NCVER student Outcomes Survey 2010 questionnaire. NCVER 9 satisfaction themes The bank of satisfaction questions in the student Outcomes Survey was based on questions developed for use in the Higher Education Course Experience Survey and the Western Australian State student Survey. The initial statistical validation of the satisfaction questions in the TAFE setting was undertaken by the Western Australian Department of Education and Training. (For more information on the history of the satisfaction questions see Bontempo & Morgan [2001] and Sevastos [2001].) Western Australia used this bank of questions in 2003 and a modified version became a constituent part of the current national student Outcomes Survey in 2004. While there have been several evaluations of the categorisation of the satisfaction questions into the three main themes, and these have provided a statistical basis for question groupings over the history of the survey (Morgan & Bontempo 2003), there has been scant progress towards creating summary measures beyond the initial categorisation into the three current themes.