Transcription of Measuring the Digital Economy: An Update Incorporating ...
1 1 Measuring the Digital Economy: An Update Incorporating Data from the 2018 Comprehensive Update of the Industry Economic Accounts Introduction The estimates presented in this paper Update the initial estimates toward a Digital economy satellite account the Bureau of Economic Analysis (BEA) published in the march 2018 working paper titled Defining and Measuring the Digital Economy. 1 These updated estimates follow the same methodology for Measuring the Digital economy BEA introduced in march 2018, but they incorporate updated underlying data published during the 2018 comprehensive Update of the Industry Economic Like the initial estimates, these updated Digital economy estimates include only items that BEA has categorized as primarily Digital . Additionally, this paper extends the time series for BEA Digital economy estimates to cover the period from 1997 to 2017.
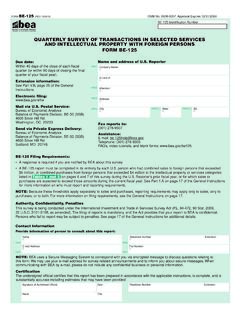
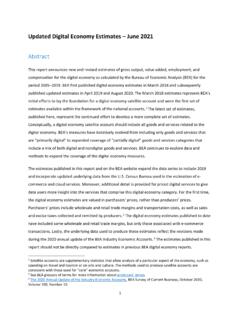
2 The updated estimates continue to show the Digital economy has been a bright spot in the economy. Digital economy real value added grew at an average annual rate of percent per year from 1998 to 2017, compared to percent growth in the overall economy. The Digital economy accounted for percent ($1, billion) of current dollar gross domestic product (GDP) ($19, billion) in 2017, up from percent in 1997. When compared with traditional industries or sectors, the Digital economy ranked just below professional, scientific, and technical services, which accounted for percent ($1, billion) of current dollar GDP, and just above wholesale trade, which accounted for percent ($1, billion) of current dollar GDP (chart 1). 2 In 2017, the Digital economy supported million jobs, which accounted for percent of total employment ( million jobs), comparable to the transportation and warehousing industry (chart 2).
3 Employees working in the Digital economy earned $132,223 in average annual compensation compared to $68,506 average annual compensation per worker for the total economy. 051015 Agriculture, forestry, fishing, and hunting Arts, entertainment, and recreation Educationa l servic es Mining Utilities Management of companies and enterprises Other servi ces, exc ept government Accommodation and food services Administrative and waste management services Transportation and warehousing Construction Information Reta il trade Wholesale tra deDigital economy Professional, scientific, and technical services Health care and social assistance Finance and insurance ManufacturingGovernment Real estate and rental and Bureauof Economic AnalysisChart 1. DigitalEconomy and Industry Share of Total Gross Domestic Product,2017 Percent of GDP3 The remainder of this report will review the definition of the Digital economy BEA relied on when developing these estimates, highlight major updates BEA incorporated into underlying national accounts data, and provide updated estimates on the size of the Digital economy.
4 Digital Economy Definition and Coverage As introduced in the march 2018 working paper, BEA includes in the Digital economy the entire information and communications technologies (ICT) sector as well as the Digital enabling infrastructure needed for a computer network to exist and operate, the Digital transactions that take place using that system ( e commerce ), and the content that Digital economy users create and access ( Digital media ). 05101520 Utilities Mining Agriculture, forestry, fishing, and hunting Real estate and rental and leasing Management of companies and enterprises Arts, entertainment, and recreation Inf ormat ion Educational services Digital economy Transportation and warehousing Wholesale trade Finance and insurance Other services, except government Construction Professional, scientific, and technical services Administrative and waste management services Manufacturing Accommodation and food services Retail trade Health care and social assistance Bureauof Economic AnalysisChart 2.
5 DigitalEconomy and Industry Share of Total Employment,2017 Percentof total employment4 The preliminary estimates published in march 2018 and this set of updated estimates included only primarily Digital goods and services. Goods and services categories based on the North American Industrial Classification System (NAICS) include Digital goods and services as well as nondigital goods and services. While BEA s conceptual definition of the Digital economy includes all Digital goods and services, BEA did not attempt to include partially Digital items in the preliminary estimates or in these updated estimates. This means that some components of the Digital economy, like peer to peer (P2P) e commerce, also known as the sharing economy, are excluded from both sets of estimates. P2P transactions such as ride sharing services rely on internet enabled devices to match supply and demand, but they also have a nondigital component of in person provision of services.
6 Splitting the output of partially Digital categories into Digital and nondigital portions will require additional source data and other resources to accurately identify the share of output that is in scope for the Digital economy. The work to identify data to include partially Digital goods and services is ongoing. 2018 Comprehensive Update of the Industry Economic Accounts Every 5 years, BEA conducts a comprehensive Update to incorporate two types of improvements: changes in definitions and classifications, which Update the accounts to more accurately portray the dynamic economy and to better facilitate comparisons with economic data available from other countries, and statistical changes, which Update the accounts through the use of new and improved estimation methods and newly available and revised source data, including the Economic Census, which is used to benchmark the During the 2018 comprehensive industry accounts Update , BEA incorporated the following major updates: New data from the 2012 detailed benchmark supply use tables (SUTs) that incorporate data from the 2012 Economic Census.
7 New data from the full time series of annual SUTs updated to be consistent with the new 2012 benchmark SUTs, including updated 2007 detailed benchmark Conversion to the 2012 NAICS from the 2007 NAICS. Changes in methodology resulting from the 2018 comprehensive Update of the National Income and Product Accounts (NIPAs).5 A brief discussion of some of these changes is presented below. For more information, please refer to the detailed articles and other information on the BEA website related to the comprehensive updates of the NIPAs and the Industry Economic 2012 Economic Cens us data The Census Bureau conducts the Economic Census every 5 years. This collection provides the most comprehensive data on economic activity by industry at the level of the smallest operating unit, the 5 establishment.
8 The Economic Census is the primary data source for the benchmark SUTs, providing information on inventories, receipts and expenses of business establishments and of government, sales by detailed industry and product line, final industry and product shipments, input costs by general category, and trade margins. BEA incorporated the detailed 2012 Economic Census data, the latest available, into the industry accounts, resulting in a new set of benchmark SUTs for 2012 and updated benchmark SUTs for 2007. The 2012 Economic Census classifies business establishments according to the 2012 NAICS. At this time, BEA has maintained the same Digital economy commodity list from the original estimates published in march 2018. The change to the 2012 NAICS did not impact this list. The full list of commodities included in the Digital economy estimates is available in the Appendix of the march 2018 report.
9 Software and communications equipment prices The rapid pace of innovation in the Digital economy makes price measurement challenging. Ultimately, the goal is to capture the change in price of a constant quality good or service to improve deflation of BEA estimates. For example, in the 1980s, computers were large and expensive with relatively little functionality compared to what the lightweight and affordable computers of today can do. Because of this, the Producer Price Index (PPI) for electronic computers and computer equipment fell from approximately 300 in 1991 to 27 in 2018, reflecting both the fall in computer prices and the increase in the functionality provided by computers. BEA is committed to improving price measurement for high tech goods and services. During the 2018 NIPA comprehensive Update , BEA introduced improved price indexes for software that implement an explicit production adjustment to the input cost index for prepackaged software beginning in 1997.
10 This improvement is based on research BEA conducted using reports from academic, commercial, and public sources. BEA also extended improvements made in past updates to historical BEA also incorporated a newly available price index for cellular phones from the Federal Reserve Board beginning with 2002 data. Additionally, in January 2018, BEA began making explicit quality adjustments for smartphones, generated using hedonic modeling Although the explicit quality adjustments for smartphones do not affect the estimates presented in this paper, which go through 2017, future Digital economy estimates will benefit from this improved measure of prices. Results Gros s domes tic product or value added GDP is the value of the goods and services produced by the nation s economy less the value of the goods 6 and services used up in production.


![[FR Doc. 85-22841 Filed 9-24-85; 8:45 am]](/cache/preview/9/e/3/b/4/0/3/e/thumb-9e3b403ea4e7f3535028925dd1410980.jpg)