Transcription of METHOD 6010C INDUCTIVELY COUPLED PLASMA-ATOMIC …
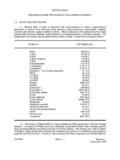
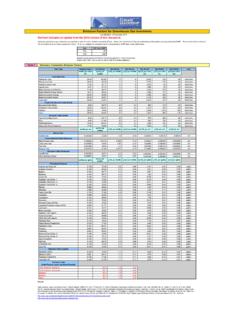
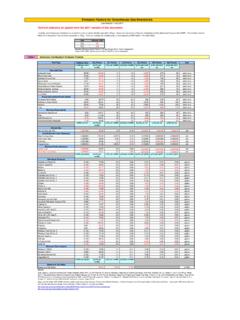
1 6010C - 1 Revision 3 November 2000 METHOD 6010 CINDUCTIVELY COUPLED PLASMA-ATOMIC EMISSION SCOPE AND APPLICATION COUPLED PLASMA-ATOMIC emission spectrometry (ICP-AES) may be usedto determine trace elements in solution. The METHOD is applicable to all of the elements listedbelow. With the exception of groundwater samples, all aqueous and solid matrices require aciddigestion prior to analysis. Groundwater samples that have been prefiltered and acidified will notneed acid digestion. Samples which are not digested require either an internal standard or shouldbe matrix-matched with the standards. If either option is used, instrument software should beprogrammed to correct for intensity differences of the internal standard between samples andstandards. Refer to Chapter Three for the appropriate digestion procedures. ElementSymbolCAS NumberElementSymbolCAS NumberAluminumAl7429-90-5 MercuryHg7439-97-6 AntimonySb7440-36-0 Molybdenum Mo7439-98-7 ArsenicAs7440-38-2 Nickel Ni7440-02-0 Barium Ba7440-39-3 PhosphorusP7723-14-0 BerylliumBe7440-41-7 PotassiumK7440-09-7 BoronB7440-42-8 SeleniumSe7782-49-2 Cadmium Cd7440-43-9 SilicaSiO27631-86-9 Calcium Ca7440-70-2 SilverAg7440-22-4 Chromium Cr7440-47-3 SodiumNa7440-23-5 CobaltCo7440-48-4 StrotiumSr7440-24-6 Copper Cu7440-50-8 ThalliumTI7440-28-0 Iron Fe7439-89-6 TinSn7440-31-5 LeadPb7439-92-1 TitaniumTi7440-32-6 LithiumLi7439-93-2 VanadiumV7440-62-2 Magnesium 1 lists the elements for which this METHOD has been validated.
2 The sensitivityand the optimum and linear ranges for each element will vary with the wavelength, spectrometer,matrix, and operating conditions. Table 1 lists the recommended analytical wavelengths andestimated instrumental detection limits for the elements in clean aqueous matrices withinsignificant background interferences. Other elements and matrices may be analyzed by thismethod if performance at the concentrations of interest (see Sec. ) is - 2 Revision 3 November addition, METHOD detection limits (MDLs) should be empirically establishedannually, at a minimum, for each matrix type analyzed (refer to Chapters One and Three forguidance) and are required for each preparatory/determinative METHOD combination used. MDLsare instrument- specific, so an MDL study must be conducted for each instrument in a should clearly understand the data quality objectives prior to analysis andmust document and have on file the required initial demonstration performance data describedin the following sections prior to using the METHOD for should consult the disclaimer statement at the front of the manual and theinformation in Chapter Two, Sec.
3 , for guidance on the intended flexibility in the choice ofmethods, apparatus, materials, reagents, and supplies, and on the responsibilities of the analystfor demonstrating that the techniques employed are appropriate for the analytes of interest, in thematrix of interest, and at the levels of concern. In addition, analysts and data users are advised that, except where explicitly specified in aregulation, the use of SW-846 methods is not mandatory in response to Federal testingrequirements. The information contained in this METHOD is provided by EPA as guidance to beused by the analyst and the regulated community in making judgments necessary to generateresults that meet the data quality objectives for the intended of this METHOD is restricted to spectroscopists who are knowledgeable in thecorrection of spectral, chemical, and physical interferences described in this METHOD .
4 SUMMARY OF to analysis, samples must be solubilized or digested using the appropriatesample preparation methods (see Chapter Three). When analyzing groundwater samples fordissolved constituents, acid digestion is not necessary if the samples are filtered and acidpreserved prior to analysis (refer to Sec. ). METHOD describes multielemental determinations by ICP-AES using sequentialor simultaneous optical systems and axial or radial viewing of the plasma . The instrumentmeasures characteristic emission spectra by optical spectrometry. Samples are nebulized andthe resulting aerosol is transported to the plasma torch. Element-specific emission spectra areproduced by a radio-frequency INDUCTIVELY COUPLED plasma . The spectra are dispersed by agrating spectrometer, and the intensities of the emission lines are monitored by photosensitivedevices.
5 Correction is required for trace element determination. Backgroundemission must be measured adjacent to analyte lines on samples during analysis. The positionselected for the background-intensity measurement, on either or both sides of the analytical line,will be determined by the complexity of the spectrum adjacent to the analyte line. The positionused should be as free as possible from spectral interference and should reflect the same changein background intensity as occurs at the analyte wavelength measured. Background correctionis not required in cases of line broadening where a background correction measurement wouldactually degrade the analytical result. The possibility of additional interferences identified in - 3 Revision 3 November should also be recognized and appropriate corrections made; tests for their presence aredescribed in Secs.
6 And Alternatively, users may choose multivariate calibration this case, point selections for background correction are superfluous since whole spectralregions are DEFINITIONSR efer to Chapter One and Chapter Three for applicable interferences are caused by background emission from continuous orrecombination phenomena, stray light from the line emission of high concentration elements,overlap of a spectral line from another element, or unresolved overlap of molecular band for background emission and stray light can usually beconducted by subtracting the background emission determined by measurements adjacentto the analyte wavelength peak. Spectral scans of samples or single element solutions inthe analyte regions may indicate when alternate wavelengths are desirable because ofsevere spectral interference.
7 These scans will also show whether the most appropriateestimate of the background emission is provided by an interpolation from measurements onboth sides of the wavelength peak or by measured emission on only one side. The locationsselected for the measurement of background intensity will be determined by the complexityof the spectrum adjacent to the wavelength peak. The locations used for routinemeasurement must be free of off-line spectral interference (interelement or molecular) oradequately corrected to reflect the same change in background intensity as occurs at thewavelength peak. For multivariate methods using whole spectral regions, background scansshould be included in the correction algorithm. Off-line spectral interferences are handledby including spectra on interfering species in the algorithm. determine the appropriate location for off-line background correction, theuser must scan the area on either side adjacent to the wavelength and record the apparentemission intensity from all other METHOD analytes.
8 This spectral information must bedocumented and kept on file. The location selected for background correction must beeither free of off-line interelement spectral interference or a computer routine must be usedfor automatic correction on all determinations. If a wavelength other than the recommendedwavelength is used, the analyst must determine and document both the overlapping andnearby spectral interference effects from all METHOD analytes and common elements andprovide for their automatic correction on all analyses. Tests to determine spectralinterference must be done using analyte concentrations that will adequately describe theinterference. Normally, 100 mg/L single-element solutions are sufficient. However, foranalytes such as iron that may be found in the sample at high concentration, a moreappropriate test would be to use a concentration near the upper limit of the analytical range(refer to Chapter Three).
9 Overlaps may be avoided by using an alternate wavelength or canbe compensated for by equations that correct for interelement contributions. Instruments6010C - 4 Revision 3 November 2000that use equations for interelement correction require that the interfering elements beanalyzed at the same time as the element of interest. When operative and uncorrected,interferences will produce false positive or positively biased determinations. More extensiveinformation on interferant effects at various wavelengths and resolutions is available inreference wavelength tables and books. Users may apply interelement correction equationsdetermined on their instruments with tested concentration ranges to compensate (off-line oron-line) for the effects of interfering elements. Some potential spectral interferencesobserved for the recommended wavelengths are given in Table 2.
10 For multivariatecalibration methods using whole spectral regions, spectral interferences are handled byincluding spectra of the interfering elements in the algorithm. The interferences listed areonly those that occur between METHOD analytes. Only interferences of a direct overlapnature are listed. These overlaps were observed with a single instrument having a workingresolution of using interelement correction equations, the interference may beexpressed as analyte concentration equivalents ( , false positive analyte concentrations)arising from 100 mg/L of the interference element. For example, if As is to be determinedat nm in a sample containing approximately 10 mg/L of Al, according to Table 2,100 mg/L of Al will yield a false positive signal for an As level equivalent to mg/L. Therefore, the presence of 10 mg/L of Al will result in a false positive signal for Asequivalent to approximately mg/L.