Transcription of METHODS OF PRESENTING DATA FROM EXPERIMENTS
1 Molecular Biology of Life Laboratory BIOL 123 Dr. Eby Bassiri 1 METHODS OF PRESENTING DATA FROM EXPERIMENTS Before we discuss the recording and presentation of data obtained from your EXPERIMENTS , there are a few terms that need be defined. When a body of knowledge becomes well developed it becomes possible to make predictions of certain outcomes. The beliefs on which the predictions are based are called axioms and the predictions are called hypotheses. Much of science advances by making predictions and testing them. This is called hypothesis testing. When predictions are not borne out, it usually indicates that axioms are not entirely correct or METHODS used were not appropriate. Thus, axioms are revised as predictions tested by properly designed EXPERIMENTS , fail to materialize. As an example, consider the problem of scientists who sought to determine if life existed in Martian soil.
2 You only test the null hypothesis. It can be accepted as true or it can be rejected as false. If accepted, then the prediction you have made as the hypothesis is untenable. In other words, your prediction is wrong. If the null hypothesis is rejected, then the hypothesis may be true but is not proven. Thus, you can be sure that your null hypothesis is wrong but your hypothesis is only supported, it is not established as a fact. The important distinction is that by rejecting the null hypothesis you show that your prediction is consistent with the axiom, not that the prediction is actually true. Many of the exercises that we do in lab verify and confirm what you were taught in lecture. The function of lab exercises is to force you to critically evaluate the evidence you have on hand and see if the conclusions logically follow. Lab exercises are not intended to be an affirmation of established facts but a skeptical testing of dogma.
3 In this light, you should establish the hypothesis that you are testing in the lab, use the lab exercise to test that hypothesis and discuss your results in light of rejecting or accepting the null hypothesis. As an example, consider the bacterial growth lab: Axiom: Viable bacteria in the inoculum will grow rapidly and increase the turbidity of the medium. Hypothesis: Absorbance of the culture medium will increase with time. Null hypothesis: No change of absorbance will occur with time after an inoculum is introduced to the culture medium. In some lab sections, the null hypothesis would have to be accepted because we observed that the absorbance either went down a little or stayed the same with respect to time. This indicates that something was not right with the axiom-- perhaps the bacteria were not viable, the culture medium was not appropriate or some other assumption about the method was violated.
4 So you see that the lab does not have to work "correctly" for hypothesis-testing. There is enough information in the lab manual text for you to start with axioms, make some testable predictions and then use the given protocols to test your predictions. The presentation of data (sing. datum) and their interpretation constitutes the core of any scientific investigation. There are many ways by which data can be presented. Each method is described in detail below. Molecular Biology of Life Laboratory BIOL 123 Dr. Eby Bassiri 2 Statements The most common way of presentation of data is in the form of statements. This works best for simple observations, such as: "When viewed by light microscopy, all of the cells appeared dead." When data are more quantitative, such as- "7 out of 10 cells were dead", a table is the preferred form.
5 Tables You should be familiar with the organization of information in tables from common experience. Here are some pointers: 1. The table should be identified by a number and have a title. 2. Experimental groups or treatments should be placed as rows in the table. 3. The first column should be labeled by identifying groups or treatments. Succeeding columns should contain measurements or observations on the groups. 4. The statistical analyses of data should be included in the table; , means, a measure of deviation about the mean and sample size should be given 5. Units of measurement should be clearly stated for each column or row. For example: Table 1. Height of different letters on microscope slides as determined with the ocular micrometer. Letter Sample size Mean (mm) Standard deviation m) I 10 E 9 K 10 Graphs Graphs are commonly used scientific illustrations.
6 There should be a good reason for using a graph rather than a table. Usually they are employed to show the functional relationship between dependent and independent continuous variables. An independent variable is one you can manipulate at will, such as the pH of a buffer or measurements during the time course of a reaction. This variable is plotted on the x-axis or abscissa. Dependent variables are the ones that are observed as the independent variable is changed, e. g., absorption, colony size, etc. The dependent variable is plotted on the y-axis or the ordinate. This convention allows the viewer to grasp the content of the graph easier because they intuitively view the x-axis and think to themselves- "at this level of treatment you get this response and at this higher level you see this much more effect". To invert the axes or plot discontinuous variables with the points connected with lines will confuse and mislead the reader.
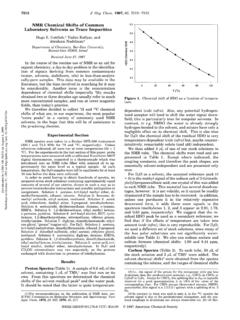
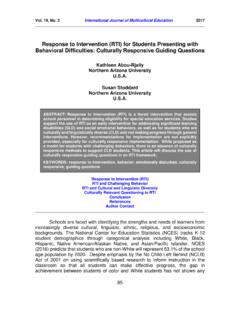
7 Molecular Biology of Life Laboratory BIOL 123 Dr. Eby Bassiri 3 It is important that you learn to read, interpret and make graphs because graphs are the best way to examine data in many instances. In biology, one usually needs only one quadrant from the standard Cartesian axes: Fig. 1. Standard Cartesian axes. The types of plots that one most often encounters in biology are (1) arithmetic and (2) semi-log. Arithmetic plots employ equal divisions between successive integers on both axes; semi-log plots use arithmetic scale on one axis and a logarithmic scale (equal divisions between successive powers of 10) on the other axis. (If you do not remember the meaning and use of log10 --and the ln function plus its relationship to log10 -- you should review them immediately because you will need them In addition to the distinctions made above about the nature of variables, these points also pertain to graphs: 1.)
8 Give the figure a number and a label. 2. Use appropriate scales so that all of the graph is utilized. 3. Always label the axes and indicate the units. 4. Indicate the standard error in the measurement by vertical error bars that show the range, standard deviation or confidence interval (see Statistical METHODS below). 5. Be cautious in the manner in which you connect data points. Obviously, you do not want to draw a line through a random scatter of points nor do you want to connect a zig-zagging line to connect these random points. Decide first if your data shows a non-random pattern. If the pattern is random omit the graph and state that in your text. If you think there is a pattern then use your judgment to fit a line or a curve through the data. This process should give you an appreciation of curve-fitting by statistical METHODS . Molecular Biology of Life Laboratory BIOL 123 Dr.
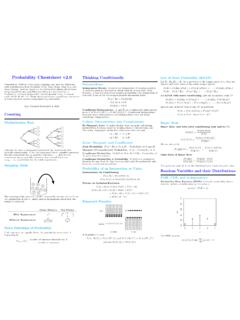
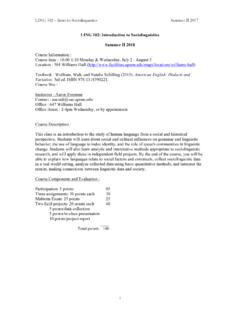
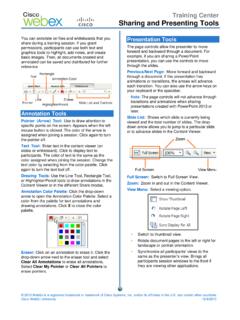
9 Eby Bassiri 4 There are many errors that can be made in the making of graphs-- a number of the common ones are depicted in Fig. 2. Be sure that you understand the point of each illustration. Fig. 2. Common errors in graphing. Molecular Biology of Life Laboratory BIOL 123 Dr. Eby Bassiri 5 Fig. 2. Common errors in graphing (cont'd). Molecular Biology of Life Laboratory BIOL 123 Dr. Eby Bassiri 6 Making graphs can be quite easy if you keep a few basic rules in mind: 1. The independent variable (the one which the experimenter varies as he wishes , time) is placed on the x-axis. 2. The dependent variable (the one that varies as a result of the variation in the experimental variable, , number of cells present/ml) is placed on the y-axis. 3. All axes must be labeled with meaning and units.
10 4. Units should be appropriate and in meaningful proportion on the two axes. 5. The graph should fill as much of the sheets as possible -- no miniatures to be read with magnifying lenses allowed. 6. You may be asked to measure the slope of a line (m) you have drawn. To refresh your memory, use the x and y coordinates of two points on the line in this equation: m=y2 y1x2 x1 (1) Histograms In some cases you have measured continuous variables in response to several discrete treatments. For example, if you measure bacterial populations in pond water in the winter, spring, summer and fall you should not graph the data as a graph with lines connecting the four seasons. The lines will mislead the reader into thinking you measured populations continually throughout the year. But you want to show the seasonal trend that is apparent.