Transcription of MULTICOMPONENT ANALYSIS USING UV/VIS …
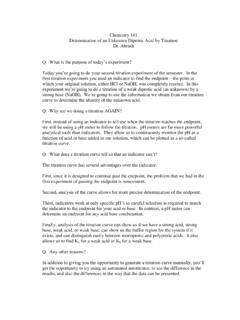
1 MULTICOMPONENT ANALYSIS USING . UV/VIS SPECTROPHOTOMETRY. Introduction The goal of this experiment is to determine the concentrations of two hydrocarbon isomers, 1-methylanthracene and 9-methylanthracene, in a solution USING absorbance measurements in the ultraviolet region of the spectrum. Both compounds are polycyclic aromatic hydrocarbons (PAHs), compounds that are generated during the incomplete combustion of organics. PAHs are ubiquitous environmental organic pollutants, and many are suspected carcinogens. The structures of the analytes is given below: 9-methylanthracene 1-methylanthracene Since the compounds are so similar, it might be expected that there is considerable overlap of absorption spectra. In this experiment, you will demonstrate that it is possible to measure the concentrations of both isomers in a mixture USING spectrophotometry.
2 Background Molecular Absorption Spectroscopy is the study of the interaction of light and matter; in spectrochemical ANALYSIS , this interaction is used as the basis for chemical ANALYSIS . Spectrochemical methods (which include methods such as IR and NMR spectroscopy) are perhaps the most widely used group of techniques in analytical chemistry; they are used for structure ANALYSIS , compound identification and quantitative ANALYSIS . Almost all spectrochemical methods of ANALYSIS depend in some way on the absorption of light energy by atoms or molecules. Light can be considered to consist of energy packets called photons, each with energy E = h! = h c ". where h is Planck's constant, c is the speed of light, is the frequency of the light, and is the wavelength of the light.
3 Recall that the energy possessed by an atom or molecule is quantized. Let's imagine an encounter between a photon and an atom, molecule or ion. If the energy of the photon exactly matches the energy Page 1. MULTICOMPONENT ANALYSIS Background difference between two energy levels in the chemical species, then there is a chance that the photon may be absorbed by the species, with a corresponding increase in energy: photon absorbed;. accompanied with a transition to a higher incident photon energy state The probability that a photon is absorbed when it encounters an atom, ion or molecule is called the transition probability of the chemical species. The internal energy of a molecule or a molecular ion is partitioned between various forms: electronic energy: energy possessed by electrons in their molecular orbitals, due to electrostatic interaction with the protons in the atomic nuclei and with the other electrons vibrational energy: energy due to periodic changes in distances (the vibrations ) between the atoms in the molecule.
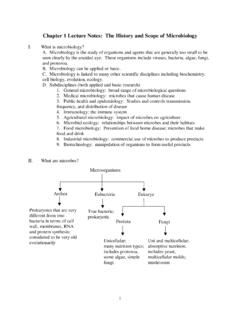
4 Rotational energy: energy due to the tumbling motion of the molecule Two distinct energy levels in a molecule may correspond to different amounts of electronic, vibrational and rotational energy. Each of these forms of energies are quantized into discrete energy levels. Thus, photon absorption by a molecule is frequently represented by a diagram such as the following: excited state energies vibrational associated with energy excitation of valence levels electron into a higher- energy MO. incident photon vibrational energies associated energy with ground state levels MO (HOMO). This figure shows molecular energy levels associated with two molecular orbitals, the ground state (HOMO) and an excited state. The longer, heavier horizontal lines represent the lowest vibrational energy levels associated with an MO, while the shorter lines represent different excited vibrational energy levels for the molecule when the valence electron is in these orbitals.
5 Note that the distance Page 2. MULTICOMPONENT ANALYSIS Background between these levels is not necessarily the same when the molecule is in the HOMO or LUMO energy states; this is because the bond energies are likely to be different in these two states. Almost all molecules at room temperature occupy the lowest energy vibrational energy level of the HOMO state. Photon absorption will promote an electron to a molecular orbital of higher energy (the LUMO, or an even higher-energy orbital); some of the photon energy may also cause the molecule to vibrate more rapidly ( , to occupy an excited vibrational energy level). This situation is shown in the previous figure, where photon absorption causes the molecule to make a transition from the lowest energy vibrational level in the HOMO to an excited vibrational energy level in the LUMO state.
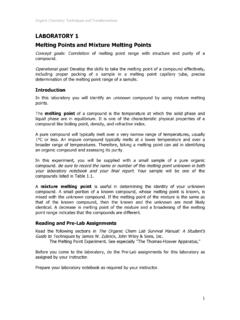
6 Such transitions are called vibronic ( vibrational and electronic ) transitions. I'm sure (!) you are asking yourselves, why are the rotational energy levels ignored in the figure? . Certainly, if the molecules where in the gas phase we must also consider the quantized rotational energy levels associated with each MO. However, in solutions interactions of the solute molecule with surrounding solvent causes a blurring of rotational energy levels, resulting in overlap of the energy levels of different rotational states. This causes broader, more featureless absorption spectra for the solvated molecule compared to the free molecule in a gaseous state, such as the one in the following figure. Absorption Spectrum Absorbance 0. 300 320 340 360 380 400.
7 Wavelength (nm). As shown here, an absorption spectrum is a plot of absorbance against photon wavelength. The absorbance, A, of a chemical sample is defined by A = log II = log(T ). 0. where I0 is the intensity of the light incident upon the sample and I is the intensity of the light after it passes through the sample. These intensities are measured by the spectrophotometer; the difference between I and I0 will be due to light absorption of chemical species in the sample. The ratio II0 is called the transmittance of the sample; it is the fraction of light that is not absorbed. When expressed as a percentage, this quantity is referred to as the percent transmittance. Note that two measurements (for I and I0) are necessary to determine the absorbance of any sample.
8 Let's imagine that we have a solution that contains a single analyte solute species. The absorbance of the solution will depend primarily on four important parameters: Page 3. MULTICOMPONENT ANALYSIS Background the wavelength of the light incident upon the solution;. the identity of the absorbing solute species;. the concentration of the solute species;. the pathlength that must be traveled by the photons through the solution. All of these parameters are collected in Beer's Law, which states that Beer's Law A " = a " bC A. where a is the absorptivity of the solute at wavelength , b is the pathlength and CA is the concentration of analyte in the solution. The absorptivity is sometimes also called the extinction coefficient. Most commonly, the pathlength, b, is expressed in cm and the concentration, C, in M; in this case, the absorptivity is referred to as the molar absorptivity and given the symbol.
9 The absorptivity is directly proportional to the transition probability of the analyte molecules, which depends on the wavelength. The use of the subscript in Beer's law emphasizes the dependence of absorptivity, a , and absorbance, A , on photon energy ( , wavelength). From Beer's law, if the cell pathlength and concentration of the compound are known, it is possible to calculate the molar absorptivity at any desired wavelength. Before doing so, however, it is a good idea to check for deviations from Beer's law. Beer's law is usually only followed over a certain concentration range of absorbers. One way to evaluate the range over which Beer's law is valid is to obtain absorption measurements of different concentrations of analyte.
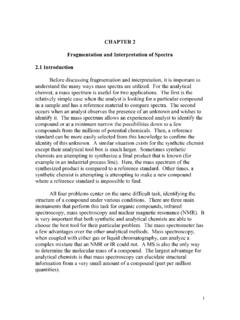
10 The value of a compound's absorptivity can be calculated from the slope of a plot of absorbance at the wavelength vs concentration. Such a plot is called a Beer's Law Plot. The slope of a Beer's Law plot is the product of absorptivity and pathlength, a vb, as shown in the following figure. A. slope = ab Beer's Law applies C. A number of compilations of molar absorptivities ( ) exist, so it is customary when reporting absorptivities to convert the value obtained from a Beer's Law plot to units of cm 1M 1. Page 4. MULTICOMPONENT ANALYSIS Background MULTICOMPONENT ANALYSIS USING Molecular Absorption Beer's law is valid simultaneously for all absorbers in a solution. Let's imagine that we have two analyte species, A and B, present in a solution.