Transcription of Multiple Regression
1 29. C H A P T E R. Multiple Regression I. n Chapter 27 we tried to predict the percent body fat of male subjects from WHO 250 Male subjects their waist size, and we did pretty well. The R2 of says that we ac- W H AT Body fat and waist counted for almost 68% of the variability in %body fat by knowing only the size waist size. We completed the analysis by performing hypothesis tests on the coef- UNITS %Body fat and inches ficients and looking at the residuals. WHEN 1990s But that remaining 32% of the variance has been bugging us. Couldn't we do a WHERE United States better job of accounting for %body fat if we weren't limited to a single predictor? WHY Scientific research In the full data set there were 15 other measurements on the 250 men. We might be able to use other predictor variables to help us account for that leftover varia- tion that wasn't accounted for by waist size. What about height? Does height help to predict %body fat? Men with the same waist size can vary from short and corpulent to tall and emaciated.
2 Knowing a man has a 50-inch waist tells us that he's likely to carry a lot of body fat. If we found out that he was 7 feet tall, that might change our impression of his body type. Knowing his height as well as his waist size might help us to make a more ac- curate prediction. Just Do It Does a Regression with two predictors even make sense? It does and that's fortu- nate because the world is too complex a place for simple linear Regression alone to model it. A Regression with two or more predictor variables is called a Multiple Regression . (When we need to note the difference, a Regression on a single predic- tor is called a simple Regression .) We'd never try to find a Regression by hand, and even calculators aren't really up to the task. This is a job for a statistics program on a computer. If you know how to find the Regression of %body fat on waist size with a statistics package, you can usually just add height to the list of predictors without having to think hard about how to do it.
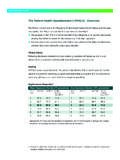
3 29-1. 29-2 Par t V I I Inferenc e When Variables Are Related A Note on Terminology For simple Regression we found the Least Squares solution, the one whose coef- When we have two or more ficients made the sum of the squared residuals as small as possible. For Multiple predictors and fit a linear Regression , we'll do the same thing but this time with more coefficients. Remark- model by least squares, we ably enough, we can still solve this problem. Even better, a statistics package can are formally said to fit a least find the coefficients of the least squares model easily. squares linear Multiple re- Here's a typical example of a Multiple Regression table: gression. Most folks just call it Dependent variable is: Pct BF. Multiple Regression . You may R-squared 5 R-squared (adjusted) 5 also see the abbreviation OLS s 5 with 250 2 3 5 247 degrees of freedom used with this kind of analy- Variable Coefficient SE(Coeff) t-ratio P-value sis. It stands for Ordinary Intercept Least Squares.
4 Waist # Height # You should recognize most of the numbers in this table. Most of them mean what you expect them to. Metalware Prices. multi - R2 gives the fraction of the variability of %body fat accounted for by the Multiple ple Regression is a valuable tool for Regression model. (With waist alone predicting %body fat, the R2 was ) The businesses. Here's the story of one Multiple Regression model accounts for of the variability in %body fat. We company's analysis of its manufac- shouldn't be surprised that R2 has gone up. It was the hope of accounting for turing process. some of that leftover variability that led us to try a second predictor. The standard deviation of the residuals is still denoted s (or sometimes se to dis- tinguish it from the standard deviation of y). The degrees of freedom calculation follows our rule of thumb: the degrees of free- dom is the number of observations (250) minus one for each coefficient estimated . for this model, 3. For each predictor we have a coefficient, its standard error, a t-ratio, and the Compute a Multiple Regression .
5 We always find multi - corresponding P-value. As with simple Regression , the t-ratio measures how many ple regressions with a computer. standard errors the coefficient is away from 0. So, using a Student's t-model, we Here's a chance to try it with the can use its P-value to test the null hypothesis that the true value of the coefficient statistics package you've been is 0. using. Using the coefficients from this table, we can write the Regression model: . %body fat 5 1 waist 2 height. As before, we define the residuals as . residuals 5 %body fat 2 %body fat. We've fit this model with the same least squares principle: The sum of the squared residuals is as small as possible for any choice of coefficients. So, What's New? So what's different? With so much of the Multiple Regression looking just like sim- ple Regression , why devote an entire chapter (or two) to the subject? There are several answers to this question. First and most important the meaning of the coefficients in the Regression model has changed in a subtle but im- portant way.
6 Because that change is not obvious, Multiple Regression coefficients Chapter 29 Multiple Regression 29-3. are often misinterpreted. We'll show some examples to help make the meaning Reading the Multiple Regression Table. You may be sur- clear. prised to find that you already Second, Multiple Regression is an extraordinarily versatile calculation, underly- know how to interpret most of the ing many widely used Statistics methods. A sound understanding of the Multiple values in the table. Here's a Regression model will help you to understand these other applications. narrated review. Third, Multiple Regression offers our first glimpse into statistical models that use more than two quantitative variables. The real world is complex. Simple mod- els of the kind we've seen so far are a great start, but often they're just not detailed enough to be useful for understanding, predicting, and decision making. Models that use several variables can be a big step toward realistic and useful modeling of complex phenomena and relationships.
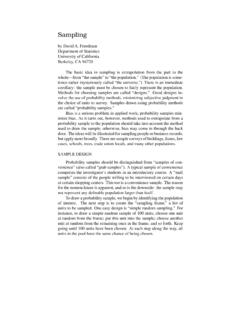
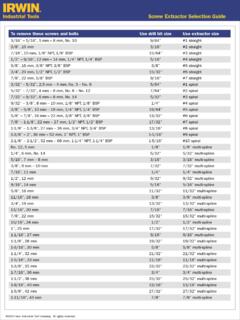
7 What Multiple Regression Coefficients Mean We said that height might be important in predicting body fat in men. What's the relationship between %body fat and height in men? We know how to approach this question; we follow the three rules. Here's the scatterplot: 40. % Body Fat 30. 20. 10. 0. 66 69 72 75. Height (in.). The scatterplot of %body fat against height seems to say that there is little relationship between these variables. Figure It doesn't look like height tells us much about %body fat. You just can't tell much about a man's %body fat from his height. Or can you? Remember, in the Multiple Regression model, the coefficient of height was , had a t-ratio of , and had a very small P-value. So it did contribute to the Multiple Regression model. How could that be? The answer is that the Multiple Regression coefficient of height takes account of the other predictor, waist size, in the Regression model. To understand the difference, let's think about all men whose waist size is about 37 inches right in the middle of our sample.
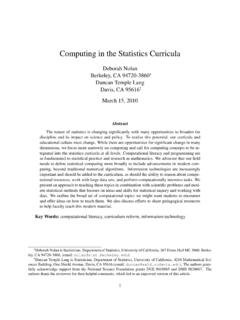
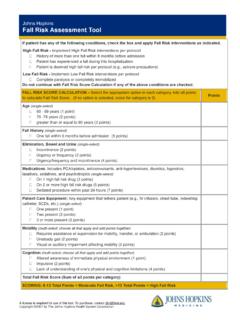
8 If we think only about these men, what do we expect the relationship between height and %body fat to be? Now a negative association makes sense because taller men probably have less body fat than shorter men who have the same waist size. Let's look at the plot: 29-4 Par t V I I Inferenc e When Variables Are Related 40. % Body Fat 30. 20. 10. 0. 66 69 72 75. Height (in.). When we restrict our attention to men with waist sizes between 36 and 38 inches (points in blue), we can see a relationship be- tween %body fat and height. Figure Here we've highlighted the men with waist sizes between 36 and 38 inches. Overall, there's little relationship between %body fat and height, as we can see from the full set of points. But when we focus on particular waist sizes, there is a relationship between body fat and height. This relationship is conditional because we've restricted our set to only those men within a certain range of waist sizes. For men with that waist size, an extra inch of height is associated with a decrease of about in body fat.
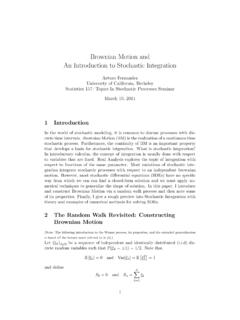
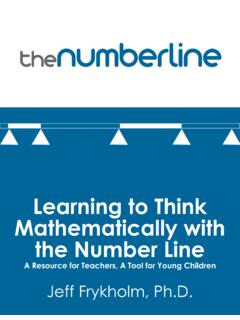
9 If that relationship is consistent for each waist size, then the Multiple Regression coefficient will estimate it. The simple Regression co- efficient simply couldn't see it. We've picked one particular waist size to highlight. How could we look at the relationship between %body fat and height conditioned on all waist sizes at the same time? Once again, residuals come to the rescue. As their name reminds us, We plot the residuals of %body fat after a Regression on waist size against the residuals are what's left over residuals of height after regressing it on waist size. This display is called a partial re- after we fit a model. That lets gression plot. It shows us just what we asked for: the relationship of %body fat to us remove the effects of some height after removing the linear effects of waist size. variables. The residuals are what's left. % Body Fat Residuals 4 0 4. Height Residuals (in.). A partial Regression plot for the coefficient of height in the Regression model has a slope equal to the coefficient value in the Multiple Regression model.
10 Figure Chapter 29 Multiple Regression 29-5. A partial Regression plot for a particular predictor has a slope that is the same as the Multiple Regression coefficient for that predictor. Here, it's It also has the same residuals as the full Multiple Regression , so you can spot any outliers or influential points and tell whether they've affected the estimation of this particu- lar coefficient. Many modern statistics packages offer partial Regression plots as an option for any coefficient of a Multiple Regression . For the same reasons that we always look at a scatterplot before interpreting a simple Regression coefficient, it's a good idea to make a partial Regression plot for any Multiple Regression coefficient that you hope to understand or interpret. The Multiple Regression Model We can write a Multiple Regression model like this, numbering the predictors arbi- trarily (we don't care which one is x1), writing b's for the model coefficients (which we will estimate from the data), and including the errors in the model: y 5 b 0 1 b 1x1 1 b 2x2 1 e.