Transcription of Nanoparticle Tracking Analysis; Sizing, Counting …
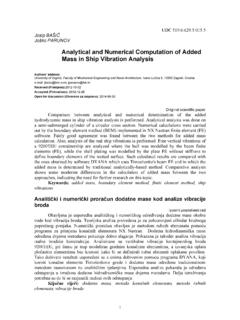
1 Nanoparticle Tracking Analysis; sizing , Counting and visualizing of NanoparticlesDr Bob Carr, Founder and CTO NanoSight LtdThe Instrument Range See us atLM10 SeriesLM20NS500 NanoSight s TechnologyAs the schematic below shows, the NanoSighttechnology comprises: a proprietary optical element illuminated by specially configured laser beamAbove: the laser as seen at low magnificationBelow: the NanoSight Viewing LM20 in PracticeLoad sample Insert unit Observe nanoparticles !The NanoSight System in ActionRegion at which illumination beam emerges into sampleBorder of sensing zoneOptimal viewing regionView of beam passing through sample and zooming into desired field of of interest An idea of the presence, size, polydispersity and concentration of nanoparticles can be obtained immediatelyon loading of sample This TiO2 sample shows clear polydispersity The particles sizes are approximately 60 nm to 800 nm An immediate Visualisation of ParticlesTitanium Dioxide (in water) Nanoparticle Tracking AnalysisNanoparticle Tracking analysis (NTA) measures particle size by video Tracking , simultaneously, many individual particles.
2 This results in a particle size distribution of high resolution, particle concentration and an ability to include additional particle characteristics such as relative light scattering intensity or fluorescence. AnalysisTrackingNanoparticlePrinciple of Measurement nanoparticles move under Brownian motion Small particles move faster than larger particles Diffusion Coefficient can be calculated by Tracking and analysing the movement of each particle separately but simultaneously. Through application of the Stokes-Einstein equation, particle size can be calculated Scattering or fluorescence properties of particles are also measured Particle concentration/number can be estimated Brownian motion of each particle is followed in real-time via video Video analysis software measures mean square displacement in two dimensions = diffusion coefficient (Dt) Particle diameter (sphere equivalent hydrodynamic) dis then obtained from the Stokes Einstein equation NTA is an absolute method therefore no user calibration is requiredNTA is an Absolute MethodKB= Boltzmann Constant= viscosityT = TemperatureDtyx24,dTKDtB3 Particle sizing in Action125 nm LiposomesAn immediate idea of sample concentration and size is gained in secondsA live view of progress ensures optimal analysis is maintained until stable size distribution profile is obtainedNanoSight provides a visualisation of the light scattered by nanoparticles -this is not a resolved Imageof the Particles Particles are too small to be imaged by microscope Small particles are visualised as point scatterers moving under Brownian motion Larger particles scatter significantly more light100+200nm polystyrene in waterParticles are Counted and Concentration is measured Particle distribution displays a number count vs.
3 Particle size* The particle concentration by user-selectable size class is provided Mixture of 100 nm and 200 nm latex microspheres dispersed in water in 1:1 ratio*(Size is not intensity weighted, as in Dynamic Light Scattering)NTA Detection LimitsMinimum Size limit is related to: Particle size Material type Wavelength and power of illumination source Sensitivity of the camera 10 -40nmMaximum Size limit is related to: Limited Brownian motion 1000-2000nmMinimum concentration is related to: Poor statistics (Requiring longer analysis time) approx 106/mlMaximum concentration is related to: Inability to resolve neighboring particles Tracks too short before crossing occurs approx 1010/mlSizeConcentration3D Plots (size v. intensity v. number)NanoSight has the unique ability to plot each particle s size as a function of its scattered intensity2D size v. number2D size v. intensity3D size v. Intensity v. concentration The ability of NanoSight to plot Nanoparticle size against Iscat allows high resolution plots to be obtained from samples in which such information may be lost in a single plot of particle size distribution only.
4 Number200 s100 s100 dimers?Scattered Intensity An Additional VariableInformation about type of particle 50nm Gold + 100nm Latex100nm + 200nm LatexPlotting size v relative scattering intensity ( particle Ri) allows differences in particle composition to be explored. Note the higher scattering but smaller size of gold v. polystyrene (left) compared to the scaling of size to intensity for two sizes of polystyrene (right)Resolving mixtures of different particle types and PS60nm Au30nm AuIn this mixture of 30nm and 60nm gold nanoparticles mixed with 100nm polystyrene, the three particle types can be clearly seen in the 3D plot confirming indications of a tri-modal given in the normal particle size distribution plot. Despite their smaller size, the 60nm Au can be seen to scatter more than the 100nm Report and sample compatible raw data filesUser-programmable Batch Measurement for Time-Based Study Particle size distribution at hourly intervals follows aggregation processSingle particle techniquesHigh resolutionMulti-parameter per particleConcentrationEnsemble techniquesLow resolutionSingle parameter of populationNo count<10nm100nm >1000nmSPME lectron MicroscopyCoulterSLS/FraunhoferDLS/PCSI mage analysis microscopyFFFDisc CentrifugeOptical counterWhere NanoSight sits in relation to other particle sizing techniquesSize rangeComparison to Dynamic Light Scattering (DLS) DLS (alternatively known as Photon Correlation Spectroscopy (PCS))
5 Is deservedly an industry standard technique and widely used for 40 BUT In poly-dispersed samples only an averageparticle size is produced which is intensity biased towards the larger particles. Particle size distribution analysis is inherently limited to resolving only >3:1 diameter ratios. No concentration information Black-box approachDLS (Dynamic Light Scattering) also know as Photon Correlation Spectroscopy (PCS).NTA vs. DLS Monodisperse ResultDLS AnalysisSimilar NanoSight Result100 nm polystyrene reference particles in waterNote: linear scale over 0-300nm (compared to wide range logarithmic scale of DLS)Polystyrene reference spheres in water (100 nm and 200 nm)NTA vs DLS Bimodal SampleWith NTA, the analysis clearly shows both 100nm and 200nm get down to 1 ratioIn DLS, 100 nm particles are not detected as their presence is masked by the higher scatter signal of the 200 nm particles?Data reproduced from Filipe, Hawe and Jiskoot (2010) Critical Evaluation of Nanoparticle Tracking analysis (NTA) by NanoSight for the Measurement of nanoparticles and Protein Aggregates ,Pharmaceutical Research, DOI: NTA (red profiles) v DLS (blue bars) for mixtures of polystyrene of different sizesNTA v.
6 DLS NTA is not intensity-weighted towards larger particles . DLS is. While DLS is an ensemble technique, NTA operates particle-by-particle NTA has much higher resolving power with respect to multimodal and polydisperse samples and heterogenous/mixed sample types NTA requires no information about collection angle, wavelength or solvent refractive index. DLS does. NTA provides particle concentration information. DLS doesn t. Unique view from NanoSight shows the sample and validates particle size distribution data Number vs. Intensity vs. Size is provided for each particle size class in NTA. Now multi-parameter -per particleNanoSight s Advantages vs. DLS/PCSThe NanoSight system is widely applicable Liposomes and other drug delivery vehicles Virus samples Protein aggregation Ink jet inks and pigment particles Magnetic nanoparticles Multi-walled Carbon nanotubes Cosmetics Foodstuffs Ceramics Fuel additives Metal oxides in magnetic storage media Precursor chemicals for wafer fabrication.
7 Quantum dots Polymers and colloids CMP Slurries Nanobubbles BASF, Europe BP Castrol, Europe DuPont, USA Epson, Japan Exxon Mobile, USA GlaxoSmithKline, Europe Merck, USA Medimmune Nestle, Europe NIST, over 100 major universities and academic institutions + units sold world-wideSelected Users Novartis, Europe Proctor & Gamble, USA Roche, Europe Smith & Nephew, Europe Solvay, Europe Toshiba, Japan Unilever, Europe US EPA US Forces Wyeth Biopharma, USAE xample 1: Purified Influenza Virus The ability to count viruses in liquid suspension is essential for those working in vaccine development Current methodologies for Counting such, as plaque assay, only count infectious particles which often represent a small component in attenuated vaccines perhaps only 1% of product remains infective. NanoSight analyses all particles. Particle aggregation and yield quality are factors which need to be understood when developing these viral vaccinesExample 2 Protein Aggregation at 50oC NanoSight technology has a unique application in the detection of early stage aggregation in protein therapeutics Protein monomer is too small to be individually resolved by this technique, but early stage aggregates are readily detected Protein monomer at high concentration causes high background noise in image, with the aggregate forming the resolvable particles Both size and number of aggregates can be calculated and studied, providing insight into product reproduced from Filipe et al (2010), Pharmaceutical Research, DOI: Example 3.
8 Particle Aggregation 60nm Gold DNA mediated provides an alternative to fluorescencebased assays or signal amplification proceduressuch as PCR, in nucleic aciddiagnostics In the second video the aggregates are brighter and slower moving. Their increased hydrodynamic diameter is detectedPrior to aggregationFollowing addition of DNA61 nm81 nmFluorescentoption now NanoSight LM10 system can now be (retro) fitted with a blue (405nm) or green (532nm) laser diode capable of exciting fluorophores and quantum dots Filters allow specific nanoparticles to be tracked in high backgrounds Applications in: Nanoparticle toxicity studies Nano-rheology Bio-diagnosticsA mixture of 50nm fluorescent particles and 200nm non-fluorescent particles analysed under light scatter modeSame mixture when scatter removed by fluorescence filterExample 5 -Detection of fluorescent particles in mixtureExample 6 -Fluorescence detection in biological fluidsExample of analysis of cellular micro-and nano-vesicles labelled with an appropriate fluorescent antibody.
9 Light scatterAntibody FluorescenceParticle size distribution profile (normalised) of sample under light scatter (green line) and fluorescent (red line) 7 Particle asymmetric plates which flash on and off due to their is ALWAYS and ONLY seen with very non-spherical particles High resolution particle size distribution through single particle detection and analysis Visualisation of particles down to 10 nm, dependant on material Count and concentration measurement Simultaneous scattered light and fluorescence measurement Minimal sample preparation Real time information Rapid results Low CostNanoSight in Summary latest updates and Distributor locationsNanoSight LtdMinton Park, London Road, Amesbury, Wiltshire, SP4 7RT, UKT: +44 (0)1980 676060 F: +44 (0)1980