Transcription of National Daily Cattle and Beef Summary
1 National Weekly Cow and Boneless beef Summary agricultural marketing Service Livestock, Poultry, and Grain Market News January 21, 2022. Boneless Processing beef and beef Trimmings 100% Lean Items National Central LM_XB 461 Loads Wtd Avg Change LM_XB 460 Loads Wtd Avg Loads Wtd Avg Cutter Cow Carcass Cutout Fresh 92-94% Inside Rounds - Boxed Fresh 90% Outside Rounds Fresh 85% Eye of Rounds Fresh 81% Flats and Eyes - Combos Fresh 65% Striploins Fresh 50% - Combo ( ). Ground beef Cow By-Product Drop Estimate LM_XB 459 NW_LS 444. Loads Wtd Avg CWT Live Fresh 73% CWT Dressed Fresh 81% Canadian Live Cow Prices Fresh 93% WA_LS 718 Prices in US Dollars Ground Chuck Ontario Ground Round Alberta Ground Sirloin Weekly Canadian Imports Steer/Heifer/Cow Ground beef WA_LS 637 Week ending: 1/8/22.
2 Fresh 81% Slaughter St/Hf/Cow 11,163. Fresh 93% Slaughter Bulls 144. Ground Chuck YTD St/Hf/Cow 11,163. YTD Bulls 144. Estimated Cattle Slaughter Weekly Cow Prices - Dressed Basis SJ_LS 710 LM_CT168 Breaker Boning Lean Bull Week to Date (est) 636,000 National Same Period Last Week (est) 618,000. Same Period Last Year (act) 662,000. Northwest Cow and Bull Total Through Thursday 108,000. Previous Week Total Cow & Bull Est 147,000. Southwest beef Production SJ_LS 711 1/8/2022 1/1/2022 1/9/2021. Cow and Bull Slaughter 142,602 118,041 145,642 Eastern Year to Date Totals 260,643 118,041 259,974.
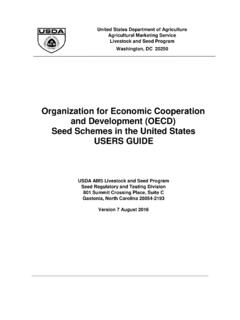
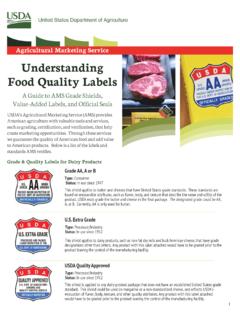
3 2020 90% Lean vs 50% Lean 100% Lean Inside Rounds $300 $590. $570. $275 $550. $250 $530. $510. $225 $490. $470. $200 $450. $175 $430. $410. $150 $390. $125 $370. $350. $100 $330. $75 $310. $290. $50 $270. $25 $250. J F M A M J J A S O N D J F M A M J J A S O N D. 90% Lean 50% Trim 2020 2021 5 yr Avg Net Slaughter Movement of Cows and Bulls Data shown in the graphs below is derived from Livestock Mandatory Price Reporting - LM_CT168 National Weekly Direct Cow and Bull Report Graph Overview: Net Slaughter Movement - SW to NW. 5,000. 4,000. Net Head Count 3,000. NW Harvest SW Origin, 2,000.
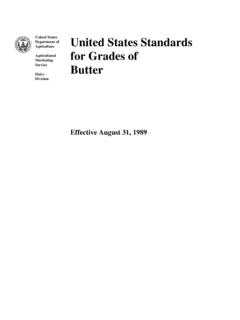
4 1,000. SW Harvest NW Origin, 0. Jan Feb Mar Apr May June July Aug Sep Oct Nov Dec -1,000. 2021 2020. This graph illustrates the net slaughter movement from area to area. For example, when the line is in positive territory, there are more cows and bulls originating in the SW area and being transferred to the NW area for harvest. When the line is in negative territory, there are more cows and bulls originating in the NW area and being transferred to the SW area for harvest. Net Slaughter Movement - East to SW. 500. SW Harvest East Origin, 0. Net Head Count Jan Feb Mar Apr May June July Aug Sep Oct Nov Dec -500.
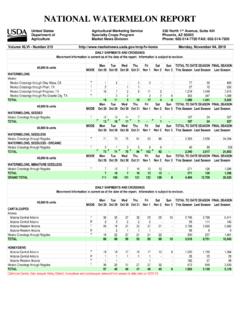
5 East Harvest SW Origin, -1,000. -1,500. 2021 2020. This graph illustrates the net slaughter movement from area to area. For example, when the line is in positive territory, there are more cows and bulls originating in the East area and being transferred to the SW area for harvest. When the line is in negative territory, there are more cows and bulls originating in the SW area and being transferred to the East area for harvest. Net Slaughter Movement - NW to East 2,000. 1,500. Net Head Count East Harvest NW Origin, 1,000. 500. NW Harvest East Origin, 0. Jan Feb Mar Apr May June July Aug Sep Oct Nov Dec -500.
6 2021 2020. This graph illustrates the net slaughter movement from area to area. For example, when the line is in positive territory, there are more cows and bulls originating in the NW area and being transferred to the East area for harvest. When the line is in negative territory, there are more cows and bulls originating in the East area and being transferred to the NW. area for harvest. Source: USDA Livestock, Poultry, and Grain Market News Des Moines, Iowa | 515-284-4460 |