Transcription of National Plug-In Electric Vehicle Infrastructure Analysis
1 National Plug-In Electric Vehicle Infrastructure Analysis September 2017 (This page intentionally left blank) National Plug-In Electric Vehicle Infrastructure Analysis iii Authors Eric Wood, Cl ment Rames, Matteo Muratori, Sesha Raghavan, and Marc Melaina National Renewable Energy Laboratory Acknowledgments This study was supported by the Department of Energy s Vehicle Technologies Office. The authors would specifically like to thank Michael Berube, Sarah Olexsak, Jacob Ward, Rachael Nealer, and David Gohlke for their guidance and support. Additional thanks to Jarett Zuboy for insightful suggestions and contributions during the internal writing and editing process, to Julia Thomas and Stephanie Price for providing timely and thorough reviews, and to Ted Kwasnik for support with geographic information systems. Special thanks to those who contributed reviews during various phases of the work, including: Nick Nigro (Atlas Public Policy) Kadir Bedir (California Energy Commission) Tyler Svitak (City and County of Denver) Marcus Alexander ( Electric Power Research Institute) Wayne Killen (Electrify America) Michael Tamor (Ford Motor Company) Britta Gross (General Motors) Matthew Goetz (Georgetown Climate Center) Michael Nicholas (International Council on Clean Transportation) Kathy Kinsey (Northeast States for Coordinated Air Use Management) Ralph Troute (Sacramento Municipal Utility District) Don MacKenzie (University of Washington) Susan Burke, Meredith Cleveland ( Environmental Protection Agency) Michael Scarpino, Diane Turchetta, John Davies, Tianjia Tang (.)
2 Federal Highway Administration) National Plug-In Electric Vehicle Infrastructure Analysis iv List of Acronyms BEV battery Electric Vehicle BEVxxx battery Electric Vehicle with an Electric range of xxx miles DC direct current DCFC direct current fast charging DOE Department of Energy DOT Department of Transportation EV Electric Vehicle EVI-Pro Electric Vehicle Infrastructure Projection Tool eVMT Electric Vehicle miles traveled EVSE Electric Vehicle supply equipment FHWA Federal Highway Administration HEV hybrid Electric Vehicle HPMS Highway Performance Monitoring System INL Idaho National Laboratory L2 level 2 (charging station) LDT long-distance trip LDV light-duty Vehicle MUD multiple-unit dwelling NHTS National Household Travel Survey NREL National Renewable Energy Laboratory PEV Plug-In Electric Vehicle (BEV or PHEV) PHEV Plug-In hybrid Electric Vehicle PHEVxx Plug-In hybrid Electric Vehicle with an Electric range of xx miles SHRP2 NDS Second Strategic Highway Research Program s Naturalistic Driving Study SUV sport utility Vehicle TAF Traveler Analysis Framework VMT Vehicle miles traveled ZEV zero-emission Vehicle National Plug-In Electric Vehicle Infrastructure Analysis v Executive Summary This report addresses the fundamental question of how much Plug-In Electric Vehicle (PEV) charging Infrastructure also known as Electric Vehicle supply equipment (EVSE) is needed in the United States to support both Plug-In hybrid Electric vehicles (PHEVs) and battery Electric vehicles (BEVs).
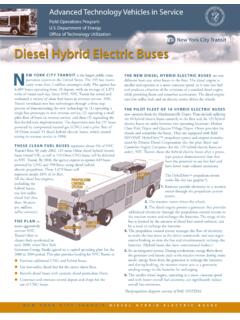
3 It complements ongoing EVSE initiatives by providing a comprehensive Analysis of National PEV charging Infrastructure requirements. The result is a quantitative estimate for a network of non-residential (public and workplace) EVSE that would be needed to support broader PEV adoption. The Analysis provides guidance to public and private stakeholders who are seeking to provide nationwide charging coverage, improve the EVSE business case by maximizing station utilization, and promote effective use of private/public Infrastructure investments. The Analysis is organized around the non-residential EVSE network required to meet consumer coverage expectations and to satisfy consumer demand in high-PEV-adoption scenarios. Coverage and charging demand estimates needed to serve growing PEV markets are made for the communities where people live and the highway corridors on which they travel (Figure ES-1) , including four specific geographic areas: Cities (486 Census Urban Areas, population greater than 50,000, 71% of population) Towns (3,087 Census Urban Clusters, population 2,500 to 50,000, 10% of population) Rural Areas (regions not covered by Census Urban Areas/Clusters, 19% of population) Interstate Highway System Corridors (28,530 miles of highway).
4 Figure ES-1. Cities (yellow polygons), towns (purple points), and interstates (thick red lines) considered in this Analysis . (Satellite imagery credit: 2017 Google, Map Data 2017 Tele Atlas) While this work is not intended to forecast future PEV markets, scenarios are developed to exercise the Infrastructure estimation methodology and highlight sensitivities. The Analysis assigns no probabilities to any PEV market or technology scenarios and considers none of the scenarios as most likely. However, a central scenario is established from which individual elements of the modeling framework are studied using National Plug-In Electric Vehicle Infrastructure Analysis vi parametric sensitivity Analysis as shown in Table ES-1. The central scenario and bounds on the accompanying sensitivities have been developed using a combination of existing PEV market/technology data and engineering judgement to represent a set of scenarios that are illustrative of the role that key variables play in dictating PEV Infrastructure requirements.
5 The goal of this scenario development is to estimate the magnitude of PEV Infrastructure requirements (relative to a growing National fleet of PEVs) and to highlight dependencies with consumer preferences and technology development. Table ES-1. PEV Market Conditions for the Central Scenario and Sensitivities Explored Variable Central Scenario Sensitivity PEV Total 15M (linear growth to 20% of LDV sales in 2030) 9M (growth to 10% of 2030 sales) 21M (growth to 30% of 2030 sales) PEV Mix (range preference) Mix PHEV20 10% PHEV50 35% BEV100 15% BEV250 30% PHEV20-SUV 5% BEV250-SUV 5% Long / Short PHEV20 0% / 40% PHEV50 50% / 0% BEV100 0% / 50% BEV250 40% / 0% PHEV20-SUV 0% / 10% BEV250-SUV 10% / 0% Share of PEVs in Cities (w/ pop. > 50k) 83% (based on existing HEVs) 71% (based on existing LDVs) 91% (based on existing PEVs) PHEV:BEV Ratio 1:1 4:1 to 1.
6 4 PHEV Support Half of full support No PHEV support to full support (maximize PHEV eVMT) SUV Share 10% 5% to 50% % Home Charging 88% 88%, 85%, and 82% Interstate Coverage Full Interstate Mega-regions, 80% of Long Distance Trips (Traveler Analysis Framework [TAF]), and Full Interstate Corridor DCFC Spacing 70 miles 40 to 100 miles DCFC Charge Time 20 minutes (150 kW) 10 to 30 minutes (400 to 100 kW) BEVxxx = battery Electric Vehicle with a range of xxx miles DCFC = direct current fast charging eVMT = Electric Vehicle miles traveled kW = kilowatt LDV = light-duty Vehicle PHEV = Plug-In hybrid Electric Vehicle PHEVxxx = Plug-In hybrid Electric Vehicle with a range of xxx miles SUV = sport utility Vehicle The Analysis relies on advanced PEV simulations using millions of miles of real-world daily driving schedules sourced from large public and commercial travel data sets.
7 Technical considerations are made for the spatial National Plug-In Electric Vehicle Infrastructure Analysis vii density of PEVs concentrated in cities and towns, ambient temperature effects on Electric driving range, and frequency of long distance driving days requiring non-residential EVSE. Simulations are rooted in a set of foundational assumptions which are applied across all scenarios. For example, consumers are simulated in all scenarios as preferring to perform the majority of charging at their home location. This assumption produces simulation results in the central scenario where 88% of PEV charging takes place at home locations (due to the large amount of time vehicles are parked at home and relatively short typical daily driving distances), consistent with early market findings in the EV Project. Charging at non-residential stations is simulated on an as-necessary basis such that consumers are able to maximize Electric Vehicle miles traveled (eVMT).
8 Additionally, it is assumed that future PEVs will be driven in a manner consistent with present day gasoline vehicles ( , 70% of daily driving under 40 miles and 95% under 100 miles). While impacts of transportation network companies ( , Uber, Lyft) and advances in automated driving technology are not considered in this Analysis , interactions between evolving mobility patterns and refueling Infrastructure supporting advanced vehicles are currently being investigated by the consortium of National laboratories participating in the Department of Energy s SMART Mobility Initiative. Analysis results for the central scenario are summarized in Table ES-2. Results are reported as numbers of direct current fast charging (DCFC) stations required to provide an acceptable level of coverage and the number of plugs required to satisfy PEV charging demand.
9 Figure ES-2 and Figure ES-4 highlight the sensitivities of these values to the many variables explored in the Analysis . Table ES-2. Summary of Station and Plug Count Estimates for the Central Scenario (15M PEVs in 2030) Cities Towns Rural Areas Interstate Corridors PEVs 12,411,000 1,848,000 642,000 DCFC Stations (to provide coverage) 4,900 3,200 400 Plugs (to meet demand) 19,000 4,000 2,000 2,500 Plugs per station Plugs per 1,000 PEVs Non-Res L2 Plugs (to meet demand) 451,000 99,000 51,000 Plugs per 1,000 PEVs 36 54 79 Note: Station count estimates for providing a minimum level of coverage have been omitted for community L2 stations under the assumption that non-residential L2 is primarily used for charging within walking distance of a destination (based on the low charge power and long charge time of L2 stations) and coverage for every destination was considered unrealistic for the early PEV market (however, demand estimates for L2 plug counts are included).
10 Similarly, coverage estimates are omitted for DCFC stations in rural areas as coverage provided by stations in cities/towns and along interstate corridors was deemed sufficient. National Plug-In Electric Vehicle Infrastructure Analysis viii Non-Residential Charging for Communities The Analysis first estimates the minimum DCFC coverage requirements for dispelling range anxiety concerns by providing a safety net of DCFC stations in cities and towns for emergency situations (such as failing to overnight charge at home). To ensure that BEV drivers in cities are never more than 3 miles from a DCFC station, approximately 4,900 DCFC stations are required across the United States. Providing the same level of coverage for towns would require approximately an additional 3,200 DCFC stations. The Analysis also estimates non-residential charging stations (work and public) required to satisfy intracommunity charging demands.