Transcription of National Vital Statistics Reports
1 National Vital Statistics Reports Volume 67, Number 8 november 7, 2018. Births: Final Data for 2017 . by Joyce A. Martin, , Brady E. Hamilton, , Michelle Osterman, , Anne K. Driscoll, , and Patrick Drake, , Division of Vital Statistics Abstract the birth certificates of the million births that occurred in 2017 are presented. Data are presented for maternal age, live- Objectives This report presents 2017 data on births birth order, race and Hispanic origin, marital status, tobacco according to a wide variety of characteristics. Trends in fertility use, prenatal care, source of payment for the delivery, method patterns and maternal and infant characteristics are described of delivery, gestational age, birthweight, and plurality. Selected and interpreted. data by mother's state of residence and birth rates by age also Methods Descriptive tabulations of data reported on are shown.
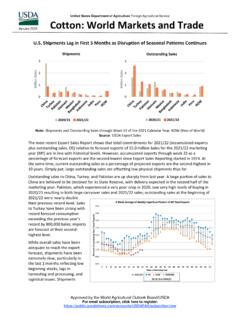
2 Trend data for 2010 to 2017 are presented for 2016 2017 . 20. 16. 12. Percent 8 4. 0. Total White Black AIAN Asian NHOPI Hispanic Non-Hispanic NOTES: AIAN is American Indian or Alaska Native; NHOPI is Native Hawaiian or Other Pacific Islander. SOURCE: NCHS, National Vital Statistics System, Natality. Figure 1. Percentage of women who smoked during pregnancy, by race and Hispanic origin: United States, 2016. and 2017 . DEPARTMENT OF HEALTH AND HUMAN SERVICES. Centers for Disease Control and Prevention National Center for Health Statistics National Vital Statistics System 2 National Vital Statistics Reports , Vol. 67, No. 8, november 7, 2018. selected items. Trend data by race and Hispanic origin are shown Epidemiologic Research (WONDER). This easy-to-use Web for 2016 and 2017 . system makes CDC's information resources available to public Results A total of 3,855,500 births were registered in the health professionals and the public at large (7).
3 United States in 2017 , down 2% from 2016. Compared with rates in 2016, the general fertility rate declined to births per 1,000 2003 revision of Standard Certificate of women aged 15 44. The birth rate for females aged 15 19 fell 7% in 2017 . Birth rates declined for women in their 20s and 30s Live Birth but increased for women in their early 40s. The total fertility rate Starting in 2016, all 50 states, , Puerto Rico, Guam, declined to 1, births per 1,000 women in 2017 . Birth rates Commonwealth of the Northern Marianas, and Virgin for both married and unmarried women declined from 2016 to Islands reported data based on the 2003 Certificate of Live 2017 . The percentage of women who began prenatal care in the Birth. American Samoa continued to report based on the 1989. first trimester of pregnancy rose to in 2017 ; the percentage birth certificate revision. Items that are nationally available for of all women who smoked during pregnancy declined to 2016 and described in this report and in Births: Final Data The cesarean delivery rate increased to following 4 years for 2016 (4) are: tobacco use before and during pregnancy of declines.
4 Medicaid was the source of payment for of all (Figure 1), usage and timing of prenatal care, source of payment births in 2017 , up 1% from 2016. The preterm birth rate rose for for the delivery, primary cesarean delivery, and vaginal delivery the third straight year, as did the rate of low birthweight. Twin and following a previous cesarean delivery (VBAC). Also available are triplet and higher-order multiple birth rates were essentially stable summary Statistics without more detail on a number of items new in 2017 . to the report: pregnancy resulted from infertility treatment, receipt of WIC (Special Supplemental Nutrition Program for Women, Keywords: birth certificate maternal and infant health birth Infants, and Children) food for the pregnancy, prepregnancy rates maternal characteristics and gestational diabetes, prepregnancy body mass index, and whether the infant was breastfed at discharge (Tables 13 and Introduction 14).
5 Internet-only tables also include a number of new items: interval since last live birth, pregnancy risk factors, infections This report presents detailed data on numbers and during pregnancy, obstetric procedures, characteristics of labor characteristics of births in 2017 , birth and fertility rates, maternal and delivery, maternal morbidity, and abnormal conditions of the demographic and health characteristics, medical and health care newborn and congenital anomalies; see List of Detailed Tables. utilization, source of payment for the delivery, and infant health For information on data quality, see the 2013 National Vital characteristics. A report of provisional birth Statistics for 2017 . Statistics Report that assessed the quality of selected medical presented data on selected topics based on a sample of nearly all and health data from the 2003 revised birth certificate (8), and ( ) 2017 births (1); a National Center for Health Statistics the 2017 User Guide (9).
6 Data Brief presented selected characteristics based on final data for 2017 births (2). The 2017 report marks the second year for which data for Methods all 50 states and the District of Columbia ( ) are based on Data shown in this report are based on 100% of the birth the 2003 revision of the Certificate of Live Birth. National certificates registered in all states and More than 99%. data on race and Hispanic-origin categories based on the 1997. of births occurring in this country are registered (9). Tables Office of Management and Budget (OMB) standards (3) are also showing data by state also provide separate information for presented for the second year, allowing for the presentation Puerto Rico, Virgin Islands, Guam, American Samoa, and of data by single race and Hispanic origin for 2016 and 2017 . Northern Marianas. These areas, however, are not included in These race and Hispanic-origin groups non-Hispanic single- totals for the United States.
7 Race white, non-Hispanic single-race black or African American, The 2003 revision of the Standard Certificate of Live non-Hispanic single-race American Indian or Alaska Native Birth allows the reporting of more than one race (multiple races). (AIAN), non-Hispanic single-race Asian, and non-Hispanic for each parent (10), in accordance with the revised standards single-race Native Hawaiian or Other Pacific Islander (NHOPI) . issued by OMB in 1997 (3). Starting in 2016, all 50 states, , differ from the bridged-race categories shown in most Reports Puerto Rico, Guam, Northern Marianas, and Virgin Islands that are based on data from 2015 and earlier. A comparison reported race data in accordance with these 1997 OMB standards between bridged- and single-race data by selected characteristics that allow for the reporting of a minimum of five race categories is shown in Births: Final Data for 2016 (4).
8 Either by single race ( , reported alone) or in combination In addition to the tabulations included in this report, ( , more than one race or multiple races) (3). The race and more detailed analysis is possible by using the annual natality Hispanic-origin groups shown in this report follow the 1997. public-use file. The data file may be downloaded from: standards and differ from the bridged-race categories shown in most previous Reports that are based on data from 2015 and (5). The public-use file does not include geographic detail, but earlier (11). The new categories are: non-Hispanic single-race a file with this information may be available upon request (6). white, non-Hispanic single-race black or African American, Birth data may also be accessed via the Centers for Disease non-Hispanic single-race AIAN, non-Hispanic single-race Asian, Control and Prevention's (CDC) Wide-ranging Online Data for non-Hispanic single-race NHOPI, and Hispanic.
9 For brevity, text National Vital Statistics Reports , Vol. 67, No. 8, november 7, 2018 3. references to non-Hispanic white or non-Hispanic black women shown in this report, and the Internet tables, imputation omit the term single-race. Because single-race data are not techniques used, computation of derived Statistics , and available for the entire United States prior to 2016, this report definitions of terms, see the User Guide (9). only makes comparisons by race between 2016 and 2017 . For more information on differences between single- and bridged- race groups, see Births: Final Data for 2016 (4). Demographic Characteristics Race and Hispanic origin are reported independently on (Tables 1 12). the birth certificate. Most tables in this report show data for the categories of non-Hispanic single-race white, non-Hispanic Births and birth rates single-race black, and Hispanic.
10 Selected tables also include data for non-Hispanic single-race AIAN, non-Hispanic single- Number of births race Asian, and non-Hispanic single-race NHOPI. Data are also In 2017 , 3,855,500 births were registered in the presented in some tables for specific Hispanic groups: Mexican, United States, down 2% (or 90,375 births) from 2016 (Table 1, Puerto Rican, Cuban, Central and South American, and other Figure 2). This is the third year that the number of births has and unknown Hispanic. declined following an increase in 2014. Prior to that year, the Trend tables included in the detailed tables for this report number of births declined steadily from 2007 through 2013 (11). include the years 2010 2017 ; see List of Detailed Tables. Longer- Among the largest race and Hispanic-origin groups, term trends previously shown in this report series can be found the number of births declined 2% for Hispanic and 3% for in earlier-year Reports ( , Births: Final Data for 2015 ) (11).