Transcription of National Vital Statistics Reports
1 National Vital Statistics Reports Volume 69, Number 12 November 17, 2020 United States Life Tables, 2018 by Elizabeth Arias, , and Jiaquan Xu, , Division of Vital Statistics Abstract Objectives This report presents complete period life tables for the United States by Hispanic origin, race, and sex, based on age-specific death rates in 2018. Methods data used to prepare the 2018 life tables are 2018 final mortality Statistics ; July 1, 2018 population estimates based on the 2010 decennial census; and 2018 Medicare data for persons aged 66 99. The methodology used to estimate the life tables for the Hispanic population remains unchanged from that developed for the publication of life tables by Hispanic origin for data year 2006.
2 The methodology used to estimate the 2018 life tables for all other groups was first implemented with data year 2008. In 2018, all 50 states and the District of Columbia reported deaths by race based on the 1997 Office of Management and Budget revised standards for the classification of federal data on race and ethnicity. As a result, race-specific life tables for 2018 presented in this report are based on the new standard and show estimates for single-race groups. These estimates are not completely comparable with those of previous years, which are based on bridged-race groups. To show trends and document the impact of changing to the 1997 standards, life expectancy estimates for 2006 2018 are reported for bridged-race categories that were in use starting with data year 2000.
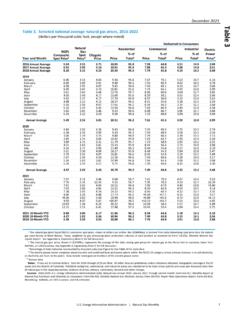
3 Results In 2018, the overall expectation of life at birth was years, increasing from in 2017. Between 2017 and 2018, life expectancy at birth increased by year for males ( to ) and females ( to ). In 2018, life expectancy at birth was for the Hispanic population, for the non-Hispanic single-race white population, and for the non-Hispanic single-race black population. Keywords: life expectancy survival death rates Hispanic origin race National Vital Statistics System Introduction There are two types of life tables: the cohort (or generation) life table and the period (or current) life table .
4 The cohort life table presents the mortality experience of a particular birth cohort all persons born in the year 1900, for example from the moment of birth through consecutive ages in successive calendar years. Based on age-specific death rates observed through consecutive calendar years, the cohort life table reflects the mortality experience of an actual cohort from birth until no lives remain in the group. To prepare just a single complete cohort life table requires data over many years. It is usually not feasible to construct cohort life tables entirely on the basis of observed data for real cohorts due to data unavailability or incompleteness (1).
5 For example, a life table representation of the mortality experience of a cohort of persons born in 1970 would require the use of data projection techniques to estimate deaths into the future (2,3). Unlike the cohort life table , the period life table does not represent the mortality experience of an actual birth cohort. Rather, the period life table presents what would happen to a hypothetical cohort if it experienced throughout its entire life the mortality conditions of a particular period in time. For example, a period life table for 2018 assumes a hypothetical cohort that is subject throughout its lifetime to the age-specific death rates prevailing for the actual population in 2018.
6 The period life table may thus be characterized as rendering a snapshot of current mortality experience and shows the long-range implications of a set of age-specific death rates that prevailed in a given year. In this report the term life table refers only to the period life table and not to the cohort life table . Life tables can be classified in two ways according to the length of the age interval in which data are presented. A complete life table contains data for every single year of age. An abridged life table typically contains data by 5- or 10-year age intervals. A complete life table can easily be aggregated into 5- or 10-year age groups (see Technical Notes for instructions).
7 Other than the decennial life tables, life tables based on data before 1997 DEPARTMENT OF HEALTH AND HUMAN SERVICES Centers for Disease Control and Prevention National Center for Health Statistics National Vital Statistics System NCHS Reports can be downloaded from: 2 National Vital Statistics Reports , Vol. 69, No. 12, November 17, 2020 are abridged life tables constructed by reference to a standard table (4). Beginning with the 2018 data year, all 50 states and the District of Columbia reported deaths based on the 2003 revision of the Standard Certificate of Death for the entire year (5). The revision is based on the 1997 Office of Management and Budget (OMB) revised standards for the classification of federal data on race and ethnicity (6).
8 The 1997 standard allows individuals to report more than one race and increased the race choices from four to five by separating the Asian and Pacific Islander groups. The Hispanic category remained consistent with previous publications. The new categories included in this report are Hispanic, non-Hispanic single-race white, and non-Hispanic single-race black. These categories differ from the bridged-race categories shown in previous Reports . Life expectancy estimates for bridged-race categories are included in this report for years 2006 2018 to document the effect of the change in race standards and show trends.
9 Estimates for bridged-race categories will continue to be calculated through data year 2020; see Technical Notes and Comparability of race-specific mortality data based on 1977 versus 1997 reporting standard for more information on differences between single-and bridged-race groups (7). This report presents complete period life tables by sex for the Hispanic, non-Hispanic single-race white, and non-Hispanic single-race black populations based on the 1997 OMB revised standards for the reporting of race and ethnicity. For years 2000 2017, multiple-race mortality data were bridged to single-race categories based on the 1977 OMB standards for the classification of race and ethnicity (8).
10 As a result, single-race categories based on the 1997 standards are not completely comparable with those based on the 1977 standards. Comparisons between data years 2000 2017 and 2018 should be interpreted taking these differences into account. In this report, life expectancy for 2018 by race is calculated for both single- and bridged-race groups to illustrate the impact of the transition to the 1997 standards. The Hispanic category is consistent with previous Reports because the classification of Hispanic origin did not change between standards (6,8). In the remainder of this report, race refers to single race based on the 1997 standard.