Transcription of NEP – Noise Equivalent Power - Thorlabs
1 NEP Noise Equivalent Power Verena Mackowiak (GmbH), Jens Peupelmann (GmbH), Yi Ma (USA), and Anthony Gorges (USA) Thorlabs , Inc., 56 Sparta Avenue, Newton, NJ 07860, USA Thorlabs GmbH, Hans-Bockler-Str. 6, 85221 Dachau, Germany Noise is an important specification when one chooses a detector for any measurement problem. There are a lot of different definitions for Noise ; one possible way to quantize Noise is the so called Noise Equivalent Power (NEP). This paper covers the definition of NEP, how it is measured, and which parameters have an impact on this value. The focus is set on its practical use and includes some examples, such as how to calculate the minimum detectable Power from the Noise specification. NEP Definition Photodetector sensitivity is a convenient, even necessary, metric by which the performance of a particular photodetector can be quantified and compared with other detectors.
2 However, it can be difficult to define and verify. The Noise Equivalent Power (NEP) is the common metric that quantifies a photodetector s sensitivity or the Power generated by a Noise source. But even this common metric can cause confusion given the different definitions and calculation methods used to describe it [1]. The most commonly used definition for NEP is the following: The input signal Power that results in a signal-to- Noise ratio (S/R) of 1 in a 1 Hz output bandwidth [2]. For detectors, such as photodetectors, the NEP expresses the sensitivity of the device and is given in Watts per square root of Hertz (W/ Hz). Essentially, the NEP expresses the minimum detectable Power per square root bandwidth of a given detector; in other words, it s a measure of the weakest optical signal that can be detected. Therefore, it is desirable to have an NEP as low as possible, since a low NEP value corresponds to a lower Noise floor and therefore a more sensitive detector.
3 Even at higher input intensities, a low NEP is beneficial since it will lead to lower Noise characteristics in the output signal. Even when blocking the optical input to a photodetector, there will be some amount of generated output Noise (such as thermal or shot Noise ) that results in a certain average output Noise Power into the connected load. This Noise Power and thus the resulting Noise - Equivalent Power , both depend on the related measurement bandwidth. This bandwidth is typically normalized to 1 Hz, which is usually far below the detection bandwidth, to allow detectors with different bandwidth specifications to be directly compared. Specifically, Thorlabs uses NEP to refer to the optical Power incident upon a photodetector system. In this case, the NEP is known as the optical NEP [1]. Alternatively, the NEP can refer to the signal Power portion that is absorbed by the detector (the Power at the output of the detector).
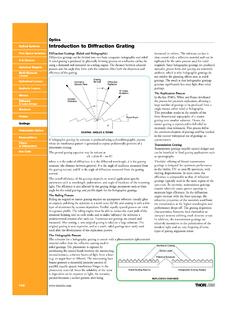
4 This can come from various sources such as Johnson or shot Noise and is called electrical NEP [1].The optical NEP is equal to the ratio of the electrical NEP and the optical coupling efficiency of the detector system. In specifications, Thorlabs assumes a coupling efficiency of 1 and does not distinguish between electrical and optical NEP. The Noise Equivalent Power depends on the optical wavelength as well, since the responsivity of the detector is wavelength dependent. For a given detector, the lowest NEP is achieved at the wavelength with maximum detector responsivity. In Thorlabs specifications, this value is stated as Minimum NEP. To Figure 1: PDB4xxA and PDB4xxC detector responsivity calculate the NEP at a different wavelength , the following formula can be used: . (1) Here, NEPmin is the NEP as given in the specifications, Rmax is the maximum responsivity of the detector, and R( ) is the responsivity of the detector at wavelength.
5 Rmax and R( ) can be read from the detector responsivity curves that are provided in the Operating Manual. Figure 1 shows a typical example. When comparing detectors of the same model but for different wavelength ranges ( , Thorlabs PDB410A and PDB410C photodetectors), their NEP is remarkably different, although their electrical amplifiers are identical. This NEP difference is mainly caused by different maximum detector responsivities. While the spectral density of the detector s output Noise is caused by different sources, the electronic Noise from the electrical amplifier is the dominate component. Transimpedance amplifiers, which are predominantly used in detectors, exhibit a frequency-dependent NEP that increases with frequency until the 3 dB cut-off frequency is reached. For this reason, the Minimum NEP value given in specifications is only valid for the specified NEP frequency range.
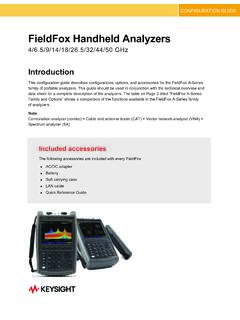
6 Note: In this paper, the NEP will often be given for a specified bandwidth. When comparing NEP values between different detector models and manufacturers, it is important to pay attention to the NEP s specified bandwidth, keeping in mind that this bandwidth typically differs from the detector s bandwidth or frequency response. Figure 2 shows a typical spectral density Noise curve for the PDB460C photodetector, measured using an electrical spectrum analyzer with a resolution bandwidth of 100 kHz. Figure 2: PDB460C RF Output Spectral Noise Minimum Detectable Optical Power The NEP of a detector is the optical Power incident to the detector that needs to be applied to equal the Noise Power from all sources in the detector; in other words, NEP is the optical Power that results in an SNR of 1 [2]. Basically, this represents the threshold above which a signal can be detected.
7 The minimum detectable Power Pmin can be easily calculated using the following formula: . (2) Here NEP( ) is the wavelength-dependent NEP and BW is the measurement bandwidth. Limiting the measurement bandwidth using additional electronic bandpass filters significantly reduces the amount of Noise in the measurement and hence the minimum detectable optical Power . Without any output filtering, the photodetector s bandwidth or frequency response is a good approximation of measurement bandwidth. It should be noted, however, that the listed NEP value is only valid for the specified frequency range. The measurement bandwidth must be less than or equal to that frequency range for the above calculation to be valid. If the measurement bandwidth exceeds that range, the NEP needs to be adjusted. However, this will increase the NEP significantly and oftentimes manufacturers will not provide the necessary information to make this.
8 The next section outlines the procedure for generalizing the NEP response. Using advanced methods such as lock-in detection, it is possible to detect much weaker signals, provided that these have a bandwidth far below the detector bandwidth. In effect, the detection bandwidth is limited to a value far below 1 Hz in order to reduce the Noise Power . This approach requires a correspondingly longer averaging time. From the Nyquist theorem, the required averaging time tavg can be calculated as: 1 2 (3) Example The NEP of the Thorlabs PDB460C balanced detector is specified as 6 pW/ Hz within an NEP frequency range from DC to 100 MHz. It can detect a signal Power of 6 pW with a signal-to- Noise ratio (SNR) of 1 after seconds averaging time within a 1 Hz bandwidth. The NEP decreases inversely to the square root of the averaging time. So, if the averaging time is extended to 50 sec, the NEP, for this example case, can be reduced by a factor of 10.
9 Using the same detector with measurement bandwidth limited to DC - 100 MHz using external filters, the minimum detectable optical Power is 60 nW. Calculating the minimum detectable Power for the full specified detector bandwidth from DC 200 MHz, the value increases to 85 nW. However, this calculation does not take into account the increase of the NEP for frequencies beyond those specified within the NEP frequency range. Therefore, Thorlabs additionally specifies the parameter Integrated Noise from DC to the cut-off frequency, referred to the input. This parameter is identical to the minimum detectable optical Power under the condition that the measurement bandwidth is equal to the detector bandwidth. For the PDB460C detector, the integrated Noise from DC 200 MHz is 130 nW. Estimating the NEP of a Specific Photodetector As mentioned earlier, sometimes it might be advantageous to know the exact shape of the NEP frequency dependency rather than the single value specified by most manufacturers.
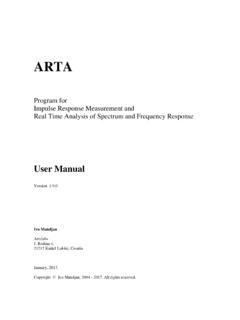
10 This section explains in detail how to calculate the NEP curve from a single measurement of the output Noise spectral density. In order to extrapolate the NEP frequency dependency curve, the NEP must be calculated in steps, starting with the minimum frequency band (typically given in the detector s specifications). In each step, the NEP is calculated for a frequency range and the results are built up to provide an expanded NEP curve. Figure 3 shows an expanded NEP graph for Thorlabs PDB460C photodiode. The output Noise spectral density can be measured either by an electrical spectrum analyzer or by sampling the detector s output signal with a fast Analog-to-Digital Converter (ADC), followed by an Fast Fourier Transformation (FFT) to calculate the Power density spectrum of the sampled signal. For detectors with a high bandwidth, an electrical spectrum analyzer is preferred due to the limited sampling rate of commercially available ADC cards.