Transcription of Notes Unit 8: Mean, Median, Standard Deviation
1 I. Mean and MedianThe MEANis the numerical average of the data Unit 8: Mean, Median, Standard DeviationThe mean is found by adding all the values in the set, then dividing the sum by the number of MEDIANis the number that is in the middle of a set of data1. Arrange the numbers in the set in order from least to Then find the number that is in the 1: These are Abby s science test scores. Find the mean and find Abby s MEAN science test score?9784738810063979586+783783 9 The mean is 879784738810063979586 The median is the numbers arelessthan the the numbers aregreaterthan the likeMEDIUM Think middlewhen you hear do we findthe MEDIAN when two numbersare in the middle?1. Add the two Then divide by + 95 = 183183 2 The median 2: Find the median. II. Standard DeviationA.
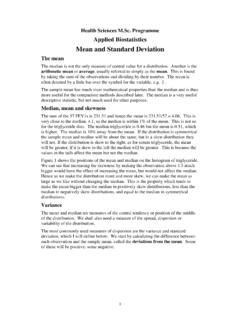
2 Definition and NotationStandard Deviationshows the variation in data. If the data is close together, the Standard Deviation will be small. If the data is spread out, the Standard Deviation will be large. Standard Deviationis often denoted by the lowercase Greek letter sigma,. B. Bell Curve: The bell curve,which represents a normal distribution of data, shows what Standard Deviation Standard Deviation away from the mean ( ) in either direction on the horizontal axis accounts for around 68 percent of the data. Two Standard deviations away from the mean accounts for roughly 95 percentof the data with three Standard deviations representing about 99 percent of the data. C. Steps to Finding Standard Deviation1) Find the meanof the data. 2) Subtract the mean from each ) square each Deviation of the ) Find the sum of the ) Divide the total by the number of )Take the square Standard Deviation FormulaThe Standard Deviation formula can be represented using Sigma Notation:2()xn The Standard Deviation formula is the square root of the expression under the radical is called the variance.
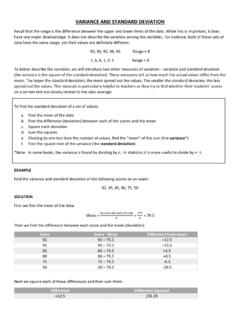
3 Ex 1: Find the Standard deviationThe math test scores of five students are: 92,88,80,68 and ) Find the mean: (92+88+80+68+52)/5 = ) Find the Deviation from the mean:92-76=1688-76=1280-76=468-76= -852-76= -243) square the Deviation from the mean:2( 8) 64 2(16) 256 2(12) 144 2(4) 16 2( 24) 576 4) Find the sum of the squares of the Deviation from the mean:256+144+16+64+576= 10565) Divide by the number of data items:1056/5 = ) Find the square root of the Thus the Standard deviationof the test scores is 2: Standard DeviationA different math class took the same test with these five test scores: 92,92,92,52, the Standard deviationfor this :1) Find the meanof the data. 2) Subtract the mean from each ) square each Deviation of the ) Find the sum of the ) Divide the total by the number of )Take the square math test scores of five students are: 92,92,92,52 and ) Find the mean: (92+92+92+52+52)/5 = 762) Find the Deviation from the mean: 92-76=16 92-76=16 92-76=16 52-76= -24 52-76= -244) Find the sum of the squares:256+256+256+576+576= 1920222(16) 256 (16) 256 (16) 256 3) square the Deviation from the mean: 5) Divide the sum of the squares by the number of items :1920/5 = 384 variance6) Find the square root of the variance:384 Thus the Standard deviationof the second set of test scores is both sets of scores.
4 Both classes have the same mean, 76. However, each class does not have the same scores. Thus we use the Standard Deviation to show the variation in the scores. With a Standard variation of for the first class and for the second class, what does this tell us? III. Analyzing the Data:Class A: 92,88,80,68,52 Class B: 92,92,92,52,52 With a Standard variation of for the first class and for the second class, the scores from the second class would be more spread out than the scores in the second :As we have seen, Standard deviationmeasures the dispersion of greater the value of the Standard Deviation , the further the data tend to be dispersed from the meanis the average, and the medianis the number in the middle when you order all the numbers from least to greatest.