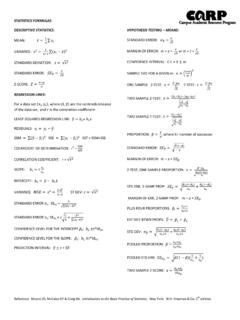
Transcription of VARIANCE AND STANDARD DEVIATION
1 VARIANCE AND STANDARD DEVIATION Recall that the range is the difference between the upper and lower limits of the data. While this is important, it does have one major disadvantage. It does not describe the variation among the variables. For instance, both of these sets of data have the same range, yet their values are definitely different. 90, 90, 90, 98, 90 Range = 8 1, 6, 8, 1, 9, 5 Range = 8 To better describe the variation, we will introduce two other measures of variation VARIANCE and STANDARD DEVIATION (the VARIANCE is the square of the STANDARD DEVIATION ).
2 These measures tell us how much the actual values differ from the mean. The larger the STANDARD DEVIATION , the more spread out the values. The smaller the STANDARD DEVIATION , the less spread out the values. This measure is particularly helpful to teachers as they try to find whether their students scores on a certain test are closely related to the class average. To find the STANDARD DEVIATION of a set of values: a. Find the mean of the data b. Find the difference ( DEVIATION ) between each of the scores and the mean c. square each DEVIATION d. Sum the squares e. Dividing by one less than the number of values, find the mean of this sum (the VARIANCE *) f.
3 Find the square root of the VARIANCE (the STANDARD DEVIATION ) *Note: In some books, the VARIANCE is found by dividing by n. In statistics it is more useful to divide by n -1. EXAMPLE Find the VARIANCE and STANDARD DEVIATION of the following scores on an exam: 92, 95, 85, 80, 75, 50 SOLUTION First we find the mean of the data: Mean = 92+95+85+80+75+506 = 4776 = Then we find the difference between each score and the mean ( DEVIATION ). Score Score - Mean Difference from mean 92 92 + 95 95 + 85 85 + 80 80 + 75 75 50 50 Next we square each of these differences and then sum them.
4 Difference Difference Squared + + + + Sum of the squares The sum of the squares is Next, we find the mean of this sum (the VARIANCE ). = Finally, we find the square root of this VARIANCE . So, the STANDARD DEVIATION of the scores is ; the VARIANCE is EXAMPLE Find the STANDARD DEVIATION of the average temperatures recorded over a five-day period last winter: 18, 22, 19, 25, 12 SOLUTION This time we will use a table for our calculations. Temp Temp mean = DEVIATION DEVIATION squared 18 18 = 22 22 = 19 19 = 25 mean 25 = 12 12- = 96 5 = sum of squares To find the VARIANCE , we divide 5 1 = 4.
5 = Finally, we find the square root of this VARIANCE . So the STANDARD DEVIATION for the temperatures recorded is ; the VARIANCE is Note that the values in the second example were much closer to the mean than those in the first example. This resulted in a smaller STANDARD DEVIATION . We can write the formula for the STANDARD DEVIATION as s = ( )2 1 where means the sum of represents each value x in the date is the mean of the values n is the total of values PRACTICE PROBLEMS 1. Find the VARIANCE and STANDARD DEVIATION for the five states with the most covered bridges: Oregon: 106 Vermont: 121 Indiana: 152 Ohio: 234 Pennsylvania: 347 2.
6 Find the VARIANCE and STANDARD DEVIATION of the heights of five tallest skyscrapers in the United States: Sears Tower (Willis Building): 1450 feet Empire State Building: 1250 feet One World Trade Center: 1776 feet Trump Tower: 1388 feet 2 World Trade Center: 1340 feet 3. Find the VARIANCE and STANDARD DEVIATION of the scores on the most recent reading test: , , , and 4. Find the VARIANCE and STANDARD DEVIATION of the highest temperatures recorded in eight specific states: 112, 100, 127, 120, 134, 118, 105, and 110. SOLUTIONS 1. ; 2. 40, ; 3. ; 4.
7 .