Example: bankruptcy
NWEA 2020 MAP Growth
associated with a percentile that shows how well the student performed on a test compared to student peers in the norming group. The relative evaluation of a student’s growth from one period to another (e.g., from fall to spring) is provided by growth norms. MAP Growth norms are distinctive in several ways.
Tags:
Information
Domain:
Source:
Link to this page:
Documents from same domain
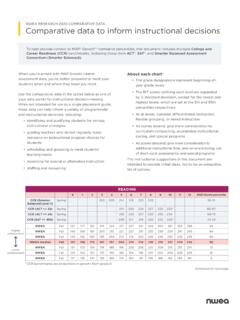
Comparative data to inform instructional decisions
teach.mapnwea.org*CCR benchmarks are projections in growth from grade 9. Higher achievement Lower achievement To help provide context to MAP® Growth™ normative percentiles, this document includes multiple College and Career Readiness (CCR) benchmarks, including those from ACT® , SAT®, and Smarter Balanced Assessment Consortium (Smarter Balanced) .
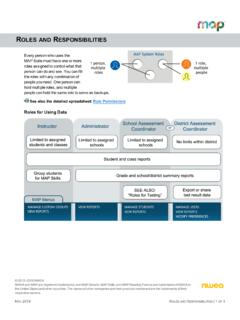
Roles and Responsibilities - teach.mapnwea.org
teach.mapnwea.org3OF3|ROLESANDRESPONSIBILITIES OCTOBER2018©NWEA RolesforMAPSkills IfyourschoolusesMAPSkills™,thereisanadditionalrole(SN Administrator),alongwithadded ...

2020 NWEA MAP Growth normative data overview
teach.mapnwea.orgStudent achievement norms The norms in the tables below have a very straightforward interpretation. For example, in the achievement norms for reading, grade 2 students in the fall had a mean score of 172.35 and a standard deviation of 15.19. To get a sense of how much variation there was, the SD
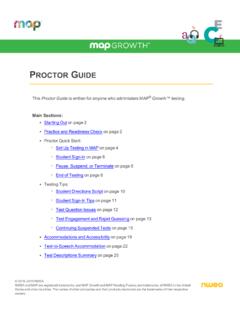
Proctor Guide - NWEA UAP Login
teach.mapnwea.org☐ On a few sample devices, access the NWEA Secure Testing browser or app. Typically, your school will already have it installed, or use the instructions referenced below. Or, if you are allowed to use a browser only, open the testing site: test.mapnwea.org. ☐ Join the testing session you started and look for warnings if the device fails to ...
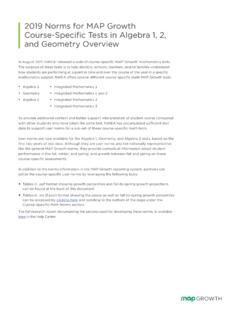
2019 Norms for MAP Growth Course-Specific Tests in Algebra ...
teach.mapnwea.orgCourse-Specific Tests in Algebra 1, 2, and Geometry Overview In August 2017, NWEA® released a suite of course-specific MAP® Growth™ mathematics tests. The purpose of these tests is to help districts, schools, teachers, and/or families understand how students are performing at a point in time and over the course of the year in a specific
TESTING TIPSFOR MAPGROWTH
teach.mapnwea.org4. Click Search and then, from the pop-up list, click Add Students. To help find students, you can sort by the Test Event Start Date column. 5. Important: Select students and click Assign Test and, if needed, Assign Accommodations. 6. Click Test Now.

Student Technology Requirements
teach.mapnwea.orgJULY12,2021 SYSTEMANDBANDWIDTHREQUIREMENTS|4OF5 Note: Additional bandwidth is needed at the beginning of each MAP Growth assessment. The initial load is approximately 2.2 MB, and the load time varies based on available bandwidth.
PROCTOR QUICK START
teach.mapnwea.org2. Ask students to learn about MAP Growth with the following choices on their log-in page: l Try the Practice Test (about 5 non-scored, sample questions) Username and Password are grow l Student Resources (explanatory videos about the test, tools, and test engagement) l Or, read the student directions script in Testing Tips for MAP Growth.
Related documents
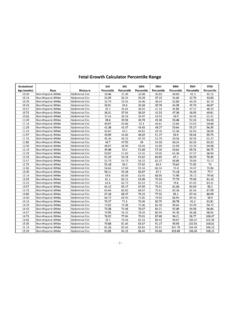
Fetal Growth Calculator Percentile Range
www.nichd.nih.govFetal Growth Calculator Percentile Range Gestational Age (weeks) Race Measure 3rd Percentile 5th Percentile 10th Percentile 50th Percentile 90th Percentile 95th Percentile 97th Percentile 10.00 Non-Hispanic White

Math - Cabrini University
www.cabrini.edu60th percentile 26. If I did worse than 27% of the students taking the SAT, what was my percentile? 73rd percentile 27. The 25th percentile is the first quartile, the 50th percentile is the second, and the 75th percentile is the third. 28.

NLN RN Composite Percentile Conversion Table
www.everettcc.eduComposite Percentile Conversion Tables . The table below will help you to determine where your score falls in relation to the scores of others who took this exam. To figure out your percentile, find your score in the Overall Score (Composite) column and then check the number in the Composite Percentile Rank.

Making Sense of Your Child’s Test Scores
www.wrightslaw.comthe 16th percentile (PR = 16). On some tests, the percentile ranks are close to, but not exactly at the expected value. A score that is two Standard Deviations above the Mean is at or close to the 98th percentile (PR = 98). A score that is two Standard Deviations below the Mean is at or close to the 2nd percentile (PR =2).

Conversion table-percentiles to z scores.
www.cedu.niu.eduPercentile : z Score : Percentile : z Score : 1st -2.41 : 26th -0.64 : 51st : 0.03 : 76th : 0.71 : 2nd -2.05 : 27th -0.61 : 52nd : 0.05 : 77th : 0.74 : 3rd -1.88 ...

Birth to 36 months: Boys, Length-for-age and Weight-for ...
www.cdc.govMay 30, 2000 · Title: Birth to 36 months: Boys, Length-for-age and Weight-for-age percentiles Author: NCHS Subject: CDC Growth Charts: United States Keywords: Growth Charts, NHANES, Birth to 36 months: Boys, Length-for-age and Weight-for-age percentiles
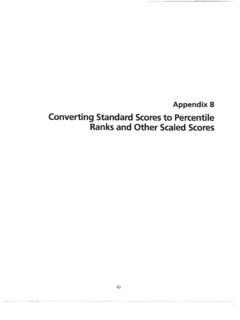
Converting Standard Scores to Percentile Ranks and Other ...
people.uncw.eduPercentile Score T-score z-s(ore Stanine Rank (M = lOa, so = 15) (M = 50, SO = 10) (M = 0, so = 1) (M = 5, SO = 2) ->99 145 80 +3.00 9 >99 144 79 +2.93 9 >99 143 - +2.87 9 >99 142 78 +2.80 9 >99 141 77 +2.73 9 ~ i >99 . 140 -+2.67 . 9 >99 139 76 +2.60 9 >99 138 75 +2.53 9 >99 . 137 …
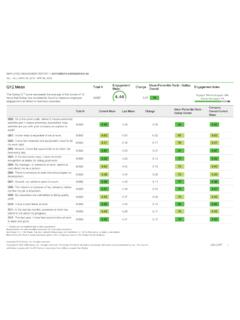
Q12 Mean Engagement Mean Percentile Rank - Gallup
storecontent.gallup.comMean Percentile Rank - Gallup Overall Engagement Index The Gallup Q12 score represents the average of the scores of 12 items that Gallup has consistently found to measure employee engagement as linked to business outcomes. 40987 0.07 79 Engaged: 74% Not Engaged: 19% Actively Disengaged: 7% Total N Current Mean Last Mean Change

FORMULA SAE Metric Imperial Metric Imperial …
www.fsaeonline.com95th percentile male. Apart from the mandated requirement that your roll hoops meet the “Percy” rule (B3.9.3), covering this range of statures will mean attention to driver visibility, steering wheel and shifter