Transcription of OECD Economic Surveys Sweden
1 OECD Economic Surveys Sweden February 2017 OVERVIEW This Overview is extracted from the 2017 Economic survey of Sweden . The survey is published on the responsibility of the Economic and Development Review Committee (EDRC) of the OECD, which is charged with the examination of the Economic situation of member countries. This document and any map included herein are without prejudice to the status of or sovereignty over any territory, to the delimitation of international frontiers and boundaries and to the name of any territory, city or area OECD Economic Surveys : Sweden OECD 2017 You can copy, download or print OECD content for your own use, and you can include excerpts from OECD publications, databases and multimedia products in your own documents, presentations, blogs, websites and teaching materials, provided that suitable acknowledgment of OECD as source and copyright owner is given.
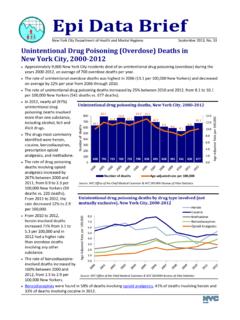
2 All requests for public or commercial use and translation rights should be submitted to Requests for permission to photocopy portions of this material for public or commercial use shall be addressed directly to the Copyright Clearance Center (CCC) at or the Centre fran ais d exploitation du droit de copie (CFC) at OECD Economic Surveys : Sweden 2017 OECD 20179 Executive summary The economy is growing strongly The rise in income inequality needs to be contained Gender equality can be pushed further1 EXECUTIVE SUMMARYOECD Economic Surveys : Sweden 2017 OECD 201710 The economy is growing stronglyEconomic growth has brought down unemploymentSource:OECD Economic Outlook 2 has been lifted by an expandinglabour force, investment and a recent pick-upin productivity. Unemployment is receding,although it remains relatively high forvulnerable groups, notably the monetary policy is supportinggrowth and inflation is picking up.
3 Macro-prudential measures have been taken to coolthe housing market. Even so, prices havereached high levels, boosted by rising income,low interest rates and supply shortages. The rise in income inequality needs to be containedInequalities have widenedSource:Statistics 2 market inefficiencies particularlypenalise households with low income andwealth, as they are less likely to own housing,and rental regulations lower their geographicaland labour market mobility. Income inequalityrose more rapidly than in any otherOECD country since the 1990s, albeit from avery low level. Capital gains boosted topincomes, while benefits increased more slowlythan wages. High labour market entrythresholds, spatial segregation, andbottlenecks in migrant settlement reduceopportunities and social mobility.
4 Reforms tohousing, wage subsidies and migrantsettlement and integration, as well as a moresystematic approach to benefits upratingwould raise the incomes and opportunities ofthe equality can be pushed furtherGender wage gaps and the glass ceiling remainSource:OECD Employment database and ILO KILM 2 is one of the most gender-equalcountries in the world, even though foreign-born women are lagging behind. Women havea high employment rate, outperform men ineducation and are well represented ingovernment and parliament. However, genderwage differences persist: women are under-represented on private company boards, insenior management positions, in many well-paid and influential professions and amongentrepreneurs. Better shared parental leaveswould raise gender equality further.
5 Fosteringwomen entrepreneurship and promoting entryof women in senior management is GDPU nemployment rate (rhs)60801001201401601801991 1996 1998 2000 2002 2004 2006 2008 2010 20121991=100 Real disposable incomeTop 5%MedianBottom 5%01020304050607080 Women employmentrateGender wage gapWomen in seniormanagement%SwedenOECD2 EXECUTIVE SUMMARYOECD Economic Surveys : Sweden 2017 OECD 201711 MAIN FINDINGSKEY RECOMMENDATIONSM acroeconomic policiesDespite strong output growth, inflation remains below target. Gradually withdraw monetary stimulus as inflation rises towards the 2% policy is mildly expansionary, due to migration-related costs. Important investments are needed in education and for the integration of refugees and Sweden s low public debt provides room for manoeuvre. However, strong fiscal buffers are needed to dampen external shocks in a small open economy.
6 Continue to pursue prudent fiscal policy, while accommodating temporary immigration-related spending to facilitate and household debtMacro-prudential measures, including a new mortgage amortisation requirement, have been introduced. Nevertheless, growth in household debt remains strong. Introduce a cap on household debt-to-income tax treatment of owner-occupied housing encourages household indebtedness and is regressive. Reform the recurrent property tax to better align tax charges with property values. Phase out the deductibility of mortgage interest rate land-use planning and low incentives for municipalities to encourage construction contribute to housing shortages, which reduce affordability and labour co-operation between central and local government in land-use planning and increase incentives for municipalities to facilitate the timely release of development land.
7 Simplify land-use planning procedures, balancing Economic , environmental and social rental regulations contribute to reducing mobility, notably for low-income households, and may contribute to spatial rental regulations to incentivise rental housing supply, mobility and better utilisation of the housing stock, while maintaining tenant protection against inequality and equal opportunitiesSocial benefits have been uprated according to the CPI or on an ad hoc basis since the 1990s, gradually increasing the gap between benefits and work income. Review annually the distributional consequences of uprating social benefits, taking equity, fiscal costs and work incentives into in migrant settlement and integration slow down labour market entry, even though the government has decided to scale up a new, collaborative approach to the settlement process and earmarked resources to address the issue.
8 Continue to simplify the procedures to help migrants get residence and work wage subsidy schemes with different target groups and different rules increase the administrative burden and reduce by merging and harmonising various wage subsidy schemes to better target the most vulnerable workers, ease the related administrative burden and increase equalityWomen take 75% of parental leaves, which affects their career prospects. Encourage parents to split parental leave more equally by continuing to increase the share reserved for each women have a very low employment rate compared to natives and many of them are neither employed, nor in training or education. Enhance active labour market policy for foreign-born women when the Introduction programme ends, to prevent them from drifting away from the labour Economic Surveys : Sweden 2017 OECD 201713 Assessment and recommendations Inclusive and green growth fosters well-being Risks are mainly related to global Economic developments Macroeconomic policies are stimulating the economy Growth is green but challenges remain Housing shortages affect Economic performance and well-being Keeping income inequality low is increasingly challenging More gender equality would enhance Economic performance and well-being5 ASSESSMENT AND RECOMMENDATIONSOECD Economic Surveys .
9 Sweden 2017 OECD 201714 Inclusive and green growth fosters well-beingSweden weathered the global financial and Economic crisis with limited damage,thanks to strong macroeconomic, fiscal and financial fundamentals, as well as acompetitive and diversified business sector. Output has grown faster than in most otherOECD countries over recent years (Figure 1, Panel A). Population increases, to a large partrelated to immigration, have contributed significantly to growth (Box 1). Even so, thecountry s GDP per capita has expanded faster than in most OECD countries (Panel B). Sweden s export performance has remained steady since the 2008 global downturn withlarge current account surpluses persisting (Panel C). In a weak global environment, growthhas been primarily driven by strong domestic consumption and investment (Panel D).
10 Although residential construction contributes heavily to the investment boom, businessinvestment has also picked up (Panel E). This has contributed to reviving labourproductivity, which is now increasing rapidly (Panel F). Growth is expected to remain solidover the coming years, even though it will slow somewhat as the economy is now operatingnear full capacity (Table 1).Inclusive, sustainable and green growth over the past two decades has underpinned ahigh quality of life for Swedes. The country has welcomed a large number of immigrants,which have both contributed to and benefitted from Economic prosperity. The foreign-bornaccounted for over 16% of the population in 2015, up from 10% in 1993 at the trough of theearly-1990s recession. The gap in GDP per capita to the upper half of OECD countries hasshrunk from about 15% in 1993 to about 5% in 2015, as a result of rising employment andstrong productivity growth (OECD, 2017).