Transcription of Oil market outlook and drivers - U.S. Energy …
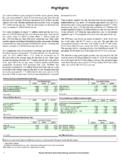
1 Energy information AdministrationIndependent Statistics & AnalysisOil and natural gas -- outlook and driversforCommittee on Earth ResourcesNational Academies of Science, Engineering, and MedicineMay 4, 2016 | Washington, DCbyHoward Gruenspecht, Deputy AdministratorWorld supply and demandmillion barrels per dayimplied stock changemillion barrels per dayNAS | Oil market outlook and drivers , May 4, 2016 Global supply has consistently exceeded demand since the start of 2014; EIA forecasts a return to market balance in the second half of 2017 Source: EIA, Short-Term Energy outlook , April 20162 Forecast-3-2-101234568284868890929496981 002011-Q12012-Q12013-Q12014-Q12015-Q1201 6-Q12017-Q1 Implied stock change and balance (right axis)World production (left axis)World consumption (left axis)020406080100120 JanAprJulOctJanAprJulOctJanAprJulOctJanA prJulOctJanAprJulOctHistorical Spot PriceSTEO ForecastNYMEX Futures PriceCurrent 95% NYMEX futures price confidence interval20132014201520162017 WTI pricedollars per barrelEIA expects WTI oil prices to remain low compared to recent history, but the market -implied confidence band is very wideSource.
2 EIA, Short-Term Energy outlook , April 20163 NAS | Oil market outlook and drivers , May 4, tight oil productionmillion barrels of oil per dry shale gas productionbillion cubic feet per dayThe has experienced a rapid increase in natural gas and oil production from shale and other tight resourcesSources: EIA derived from state administrative data collected by DrillingInfoInc. Data are through February 2016 and represent EIA s official tight oil & shale gas estimates, but are not survey data. State abbreviations indicate primary state(s).4 NAS | Oil market outlook and drivers , May 4, 2016 Source: EIA, Short-Term Energy outlook and Drilling Productivity Report, April 2016; International Energy AgencyCrude supply trends outsidethe United States (red areas below) are key to future oil market balance: geopolitical developments, exporter decisions, and the timing and magnitude of supply effects stemming from reduced investment all matter 5 NAS | Oil market outlook and drivers , May 4, outlookNAS | Oil market outlook and drivers , May 4, liquid fuels supplymillion barrels per dayNAS | Oil market outlook and drivers , May 4, 2016 Increased production of tight oil and greater fuel efficiency drive decline in petroleum and other liquid imports Note: Other includes refinery gain, biofuels production, all stock withdrawals, and other domestic sources of liquid fuelsSource.
3 EIA, Annual Energy outlook 2015 Reference case7 ProjectionsHistoryNatural gasplant liquidsOther crude oil production(excluding tight)Net petroleum and other liquids imports17%22%12%27%17%14%33%2013 Other23%Tight oilproduction21%14%21%14%202025%12%29% crude oil productionmillion barrels per dayNAS | Oil market outlook and drivers , May 4, 2016 Resource and technology assumptions have major implications for projected crude oil production beyond the next few yearsSource: EIA, Annual Energy outlook 20158 Tight oilAlaskaLower 48 maximum production level million barrels per day in 1970 Other lower 48 onshoreReferenceHigh Oil and Gas ResourceLow Oil Price-30-20-1001020304050607020052010201 520202025203020352040net crude oil and petroleum product imports as a percentage of total supplypercentNAS | Oil market outlook and drivers , May 4, reliance on net imports of petroleum and other liquids is virtually eliminated by 2035 in High Oil and Gas Resource caseSource.
4 EIA, Annual Energy outlook 20159 HistoryProjections2013 High Oil PriceHigh Oil and Gas ResourceReferenceLow Oil PriceTakeaways Natural gas North American natural gas production is more likely to be limited by demand than supply natural gas demand growth is likely to be concentrated in electricity and industrial uses; natural gas exports and use in the transportation sector, where little natural gas is used today, are also likely to grow Potential challenges to natural gas demand growth include Slow growth in electricity demand Competition from offshore stranded gas for global LNG exports and siting of gas-intensive industries. Long-term cheap oil would be another significant challenge to LNG exports Extent and nature of global price convergence in natural gas markets Future policies that target particular sources or uses of Energy or Energy -related emissions can really matter for future natural gas demandNAS | Oil market outlook and drivers , May 4, dry gas consumptiontrillion cubic feetbillion cubic feet per dayNAS | Oil market outlook and drivers , May 4, 2016 Natural gas consumption growth is concentrated in electricity generation and industry.
5 Gas use rises in all sectors except residentialSource: EIA, Annual Energy outlook 2015 Reference *Includes combined heat-and-power and lease and plant fuel**Includes pipeline fuelIndustrial*Electric powerResidentialTransportation** dry natural gas productiontrillion cubic feetbillion cubic feet per dayNAS | Oil market outlook and drivers , May 4, 2016 Shale resources remain the dominant source of natural gas production growthSource: EIA, Annual Energy outlook 2015 Reference case12 Tight gasCoalbed methaneOther lower 48 onshoreShale gas and tight oil playsAlaskaLower 48 natural gas imports and exportstrillion cubic feetbillion cubic feet per dayNAS | Oil market outlook and drivers , May 4, 2016 Projected natural gas exports reflect the spread between domestic natural gas prices and world Energy pricesSource.
6 EIA, Annual Energy outlook 201513 LNG imports-1001020 ProjectionsHistory2013201320133040-20 ReferenceLow Oil PriceHigh Oil and Gas ResourcePipeline exports to MexicoLower 48 states LNG exportsPipeline exports to CanadaPipeline imports from CanadaAlaska LNG exportsGlobal outlookNAS | Oil market outlook and drivers , May 4, 201614average annual percent change (2012 40)percent per yearNAS | Oil market outlook and drivers , May 4, 2016 Economic activity and population drive increases in Energy use; Energy intensity (E/GDP) improvements moderate this trendSource: Current Thinking15world Energy consumptionquadrillion BtuNAS | Oil market outlook and drivers , May 4, 2016 Renewables grow fastest, coal use plateaus, natural gas surpasses coal by 2030, and oil maintains its leading shareSource: Current Thinking16passenger-miles per capita (left-axis) and GDP per capita (horizontal-axis) for selected country groupings 2010 40 NAS | Oil market outlook and drivers , May 4, 2016 Passenger-miles per person will rise as GDP per capita grows.
7 Travel growth is largely outside the OECD Source: EIA, International Energy outlook 20161702,0004,0006,0008,00010,00012,000$ 0$10,000$20,000$30,000$40,000$50,000$60, 000 OECDC hinaOthernon-OECD AsiaAfricaIndia010203040 OECD EuropeOECD AsiaOECD AmericasAfricaNon-OECD Europe and EurasiaNon-OECD AmericasMiddle EastNon-OECD Asia201220202040world petroleum and other liquid fuels consumptionmillion barrels per dayNAS | Oil market outlook and drivers , May 4, 2016 Most of the growth in world oil consumption occurs in the non-OECD regions especially AsiaSource: EIA, International Energy outlook 201618world production of petroleum and other liquid fuelsmillion barrels per dayNAS | Oil market outlook and drivers , May 4, 2016 Liquid fuels supplies from both OPEC and non-OPEC producers increase through 2040 Source: Current thinking19 ActualProjected AEO 2015 Reference & HOGR Cases 1973 852000 122013 25 World Liquids Demand+3+12+12 to +13 OECD-4-2+1 Non-OECD+7+15+11 World Liquids Supply-1+12+11 to +12 Non-OPEC Supply+13+ 6 +10 to +15 OPEC Production-14+ 6 -3 to +2 LONGER TERM PERSPECTIVE: Can OPEC cohere?
8 Change in world liquid fuel balances for two 12-year historical periods with EIA projections for 2013-25 from AEO2015 (million barrels per day) 20 Source: EIA, Annual Energy outlook 2015, April 2015 NAS | Oil market outlook and drivers , May 4, 2016world natural gas consumptiontrillion cubic feetNAS | Oil market outlook and drivers , May 4, 2016 Non-OECD nations account for of projected growth in natural gas consumptionSource: Current Thinking21world change in natural gas production, 2012 40trillion cubic feetNAS | Oil market outlook and drivers , May 4, 2016 Non-OECD Asia, Middle East, and OECD Americas account for the largest increases in natural gas productionSource: Current thinking22natural gas production by typetrillion cubic feetNAS | Oil market outlook and drivers , May 4, 2016 Shale gas, tight gas, and coalbed methane become increasingly important to gas supplies, not only for the , but also China and CanadaNote: Other natural gas includes natural gas produced from structural and stratigraphic traps ( reservoirs), historically referred to as conventional : Current thinking23