Transcription of OPEC
1 Monthly Oil Market ReportOPEC18 January 2017 Feature article:Monetary policies and their impact on the oil marketOil market highlightsFeature articleCrude oil price movementsCommodity marketsWorld economyWorld oil demandWorld oil supplyProduct markets and refinery operationsTanker marketOil tradeStock movementsBalance of supply and demandMonthly endnotes13510143040556266748187 Organization of the Petroleum exporting CountriesHelferstorferstrasse 17, A-1010 Vienna, AustriaE-mail: prid(at) : Monthly Oil Market Report January 2017 1 Oil market highlights Crude Oil Price Movements The OPEC Reference Basket jumped nearly 20% in December to $ , ending above $50/b for the first time in 18 months. In contrast, the Basket s yearly average value came in at its lowest in more than 12 years at $ The oil complex surged on news of the historic cooperation between OPEC and non-OPEC.
2 ICE Brent ended $ higher at $ , while NYMEX WTI soared $ to $ For the year, ICE Brent and NYMEX WTI averaged $ and $ , respectively, the lowest since 2004. World Economy World economic growth for 2016 and 2017 has been revised up by percentage point to stand at and , respectively. The OECD growth in 2017 was revised higher to , following growth of in 2016. China s forecast remains at in 2016 and in 2017, while India s growth in 2016 was revised down slightly to , followed by growth of in 2017. After two years of recession, both Russia and Brazil are forecast to recover in 2017 with growth of and respectively. World Oil Demand Global oil demand growth in 2016 is expected at mb/d after a marginal upward revision of around 10 tb/d, mainly reflecting the better-than-expected performance in OECD Asia Pacific and Europe. World oil demand is expect to average mb/d in 2016.
3 In 2017, world oil demand is anticipated to rise by a solid mb/d y-o-y to average mb/d. This represents an upward revision of 10 tb/d, mostly due to an expected uptick in oil requirements in OECD Europe in 1Q17. World Oil Supply Non-OPEC oil supply in 2016 is now expected to show a contraction of mb/d, following an upward revision of 70 tb/d, mainly driven by higher-than-expected growth in Norway, Russia and the US. In 2017, non-OPEC oil supply is projected to grow by mb/d, representing a downward adjustment of mb/d. Downward revisions to Russia, Kazakhstan, China, Congo and Norway, were partially offset by a mb/d upward adjustment to US supply. OPEC NGL production is forecast to grow by mb/d in 2017, following growth of mb/d last year. In December, OPEC production decreased by 221 tb/d, according to secondary sources, to average mb/d. Product Markets and Refining Operations Product markets showed a mixed performance in the Atlantic Basin in December 2016.
4 US refinery margins were supported by the recovery seen in the gasoline cracks on the back of healthy domestic demand amid stronger exports to Latin America. Refinery margins in Europe weakened due to slower gasoline export opportunities and a lack of support at the middle of the barrel, despite the colder weather. In Asia, product oversupply weighed on margins. Tanker Market Tanker spot freight rates in December 2016 rose in both dirty and clean segments of the market. Average VLCC, Suezmax and Aframax spot freight rates rose by 18%, 25% and 1%, respectively, from a month before. The higher rates were driven by delays in eastern ports, pre-holiday activities and thinning tonnage supply in some areas. Average clean spot freight rates for both East and West of Suez increased in December by 19% and 26% m-o-m, respectively. Compared to the same month last year, both clean and dirty spot freight also increased on average.
5 Stock Movements Total OECD commercial stocks fell in November 2016 to stand at 2,993 mb, some 271 mb above the latest five-year average. Crude and product inventories showed surpluses of 190 mb and 82 mb, respectively. In terms of days of forward cover, OECD commercial stocks in November stood at days, some days higher than the seasonal average. Balance of Supply and Demand Demand for OPEC crude in 2016 is estimated to stand at mb/d, some mb/d higher than in 2015. In 2017, demand for OPEC crude is forecast at mb/d, a further increase of mb/d over 2016. 2 OPEC Monthly Oil Market Report January 2017 OPEC Monthly Oil Market Report January 2017 3 Monetary policies and their impact on the oil market Monetary policies continue to have an important influence on the global economy and recent efforts by OPEC and some non-OPEC producers to rebalance the oil market may turn out to be supportive for a normalisation of monetary policies by major central banks.
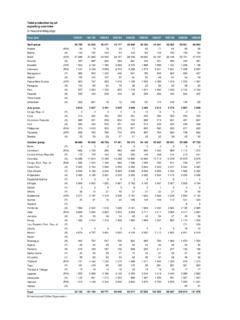
6 Rising cooperation leading to a faster rebalancing of the oil market in the energy sector is leading to healthier inflation levels in major economies and to improvements in global economic growth. Although uncertainties remain, recent oil market-related developments, in combination with further improvement in the OECD economies, an expected recovery in Russia and Brazil in 2017, and continued high growth levels in China and India, may put central banks in a better situation to gradually reduce the extraordinary monetary stimulus that has been a key factor for the global economic recovery since the Great Recession in 2008/2009. While the US Federal Reserve (Fed) has been tightening monetary supply since 2015, the European Central Bank (ECB) and other central banks are likely to continue their monetary stimulus in the short term (Graph 1). Graph 1 Liquidity injections by central banks Graph 2 NYMEX WTI & ICE Brent futures curve In the near term, the Fed is looking to raise interest rates further, following the improvement of the US economy, healthier labour market together with rising inflation of close to 2%.
7 The Fed expects that the evolution of the economy will warrant only gradual increases. However, the fiscal stimulus plans of the new administration may trigger a more rapid rise in interest rates than currently anticipated. This would particularly be the case if the major part of this stimulus is financed by an increase in government debt. Therefore, there is some uncertainty about the pace of future interest rate increases. Given the importance of the US economy and the status of the US dollar in global trade, how the oil market is affected by such developments depend on whether the issues are considered from the short- or medium-term perspective. There are numerous short-term impacts of US monetary policy on oil markets. Rising US interest rates could result in increased capital outflows from emerging and some other economies, and hence lower economic activity, especially in emerging countries , limiting oil demand growth.
8 Such capital outflows are usually accompanied by increased speculative activity, potentially impacting oil price volatility significantly in the short-term. Additionally, the expectation of higher-yielding US dollar-denominated investments may support the strengthening of the dollar versus major currency counterparts, which usually weighs on oil prices. At the same time, an increase in US dollar interest rates negatively affects oil industry investments by making them costlier, especially expensive and highly-leveraged oil developments. This also raises the cost-of-carry for oil inventories, although the impact on stock levels will depend on the shape of the futures curve. At the end of December 2016, the futures curve for both NYMEX WTI and ICE Brent was already showing the first signs of backwardation (Graph 2). While the ECB and the Bank of Japan have continued with their extraordinary monetary policies including ultra-low or negative interest rates, a shift towards normalisation is possible.
9 With inflation in these economies rising significantly from last year s levels to now stand at in the Euro-zone and in Japan, some reduction in monetary stimulus is foreseen. However, their policies are likely to remain more accommodative than the Fed s. A continued normalisation of monetary policies, indicating improving economic conditions, together with the recent historic cooperation between OPEC and non-OPEC producers, should help to bring needed stability to the oil market, hence further supporting the world economy. 203040506070809020222426283032341Q2Q3Q4Q 1Q2Q3Q4Q1Q2Q3Q201420152016%%US (LHS)Euro area (LHS)Japan (RHS)Sources: ECB, FRBBEA, CAOBOJand a percentageof GDP5354555657585960 Feb 17 Jul 17 Dec 17 May 18 Oct 18 Mar 19 Aug 19 Jan 20 Jun 20 Nov 20 Apr 21 Sep 21 Feb 22 Jul 22 Dec 22US$/bNYMEX WTIICE BrentSources: CME Groupand Intercontinental of December4 OPEC Monthly Oil Market Report January 2017 Crude Oil Price Movements OPEC Monthly Oil Market Report January 2017 5 Crude Oil Price Movements The OPEC Reference Basket (ORB) jumped nearly 20% in December to end above $50/b for the first time in a year-and-a-half at $ as the oil complex surged after the historic joint OPEC and non-OPEC decision.
10 In contrast, the 2016 yearly average value came in at its lowest in more than 12 years at $ , around 18% less than in 2015. Crude oil futures on both sides of the Atlantic rallied sharply in December, rising to well above $50/b to reach their highest levels in 18 months. Both made big gains since the end of November. For the year, however, oil futures witnessed one of the worst slump cycles since the financial crisis in 2008, resulting in their lowest yearly average in 12 years. ICE Brent averaged $ higher in December at $ , while NYMEX WTI soared $ to average $ In yearly terms, ICE Brent was 16% lower in 2016 at $ for 2016, while NYMEX WTI declined 11%, to $ Both were at their lowest since 2004. The ICE Brent/NYMEX WTI spread widened significantly in December as the US benchmark was pressured by a seasonally unusual oil stock build at the end of the year.