Transcription of OPEC
1 Monthly Oil Market ReportOPEC12 February 2018 Feature article:Review of recent global oil demand trendsOil market highlightsFeature articleCrude oil price movementsCommodity marketsWorld economyWorld oil demandWorld oil supplyProduct markets and refinery operationsTanker marketOil tradeStock movementsBalance of supply and demandiiii191231436370748087 Organization of the Petroleum Exporting CountriesHelferstorferstrasse 17, A-1010 Vienna, AustriaE-mail: prid(at) : Market Highlights OPEC Monthly Oil Market Report February 2018 i Oil Market Highlights Crude Oil Price Movements The OPEC Reference Basket increased for the fifth-straight month in January, gaining a sharp to average $ , the highest monthly average since November 2014.
2 Oil prices were supported by continuing efforts by OPEC and participating non-OPEC producers to balance the market and ten consecutive weeks of crude inventory draws amid healthy economic growth and improving oil demand. ICE Brent was $ higher at $ in January, while NYMEX WTI surged $ to $ The ICE Brent/NYMEX WTI spread narrowed 73 to $ Hedge funds raised net long positions in ICE Brent and NYMEX WTI to million contracts, a new all-time high record. The market structures for Brent, WTI and Dubai are in sustained backwardation. In the first week of February, crude oil futures lost around $6/b from the end of January amid an overall decline in equity markets and a slide in the US dollar as well as stronger-than-expected US supply and a build in US inventories.
3 World Economy The global GDP growth forecast was revised up by percentage points to for both 2017 and 2018, mainly supported by advanced economies. US growth was revised up in 2018 to , after growth of in 2017. Growth in the Euro-zone was lifted to in 2017 and in 2018. Japan s growth forecast remains unchanged in both 2017 and 2018 at and , respectively. While China s 2017 growth was better than expected at , the 2018 growth forecast remains unchanged at Also, India s GDP growth forecast remains unchanged at in 2018, after growth of in 2017. World Oil Demand World oil demand growth in 2017 is estimated to increase by mb/d, representing an upward adjustment of some 30 tb/d compared to last month s projections, mainly to reflect the continuing better-than-expected data in OECD Europe in 3Q17.
4 Total world oil demand stood at mb/d in 2017. In 2018, world oil demand is foreseen to reach mb/d, representing growth of mb/d, 60 tb/d higher than the previous month s projections and mainly reflecting the positive economic outlook. World Oil Supply Non-OPEC supply in 2017 was revised up by mb/d, mainly due to an upward revision in the OECD, to average mb/d, representing growth of mb/d. For 2018, non-OPEC supply forecast was revised up by mb/d, to average mb/d, representing growth of mb/d, which was also revised up by mb/d. Expectations for higher production in the US, UK and Brazil, as well as lesser declines in Mexico and China were the main reasons behind the upward adjustment.
5 OPEC NGLs and non-conventional liquids production averaged mb/d in 2017, up by mb/d y-o-y. OPEC NGLs are expected to grow by mb/d to average mb/d in 2018. In January 2018, OPEC crude oil production decreased by 8 tb/d, according to secondary sources, to average mb/d. Product Markets and Refining Operations Product markets in the Atlantic Basin showed mixed performance in January as refining margins in the US turned around from the declining trend recorded in the previous month, showing some gains, mainly at the top of the barrel supported by cold weather-related refinery outages. Meanwhile, in Europe, product markets lost some ground with weakening seen at the bottom of the barrel due to supply-side pressure.
6 In Asia, product markets weakened, with losses seen all across the barrel, except for the middle distillate complex, pressured by slower seasonal demand. Due to higher scheduled maintenance in February, product markets in the USGC are expected to receive some support on the back of lower product supplies. Tanker Market Dirty tanker spot freight rates experienced a general downward trend in January, which affected vessels of different classes on all reported routes. VLCC, Suezmax and Aframax average spot freight rates declined by 17%, 31% and 13% m-o-m, respectively. The decline was driven by low tonnage demand, limited inquiries and port maintenance as well as a prolonged tonnage list.
7 Similarly, clean tanker spot freight rates were weak, mainly as fixtures to eastern destinations showed lower rates than in the previous month. Oil Market Highlights ii OPEC Monthly Oil Market Report February 2018 Stock Movements Total OECD commercial oil stocks fell in December to stand at 2,888 mb. At this level, OECD commercial stocks were 109 mb above the latest five-year average. Crude and products stocks indicated a surplus of around 100 mb and 9 mb above the seasonal norm, respectively. In line with the existing overhang, the market is only expected to return to balance towards the end of this year.
8 In terms of days of forward cover, OECD commercial stocks stood at days in December, some days higher than the latest five-year average. Balance of Supply and Demand Demand for OPEC crude in 2017 is estimated to stand at mb/d, some mb/d higher than the 2016 level. In 2018, demand for OPEC crude is forecast at mb/d, slightly higher than the 2017 level. Feature Article OPEC Monthly Oil Market Report February 2018 iii Feature Article Review of recent global oil demand trends World oil demand growth exceeded mb/d for the third consecutive year to register an increase of mb/d in 2017. Total global demand is now near the mb/d threshold.
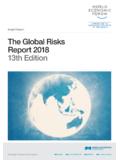
9 Cumulatively, between 2015 and 2017, the world has added around 5 mb/d of demand for oil products on the back of healthy economic conditions globally and a relatively steady product price environment. OECD Americas oil demand grew by a healthy mb/d in 2017, driven by the solid economic momentum which supported light and middle distillate consumption. In OECD Europe and Asia Pacific, following stable growth in the past two years, oil demand remained in positive territory in 2017, collectively rising by mb/d. Improvements in the economy, healthy petrochemical and transportation sectors, and colder-than-normal temperatures earlier in the year lent support to oil demand growth.
10 In non-OECD, China s oil demand growth was robust in 2017, increasing by nearly mb/d as the petrochemical and the transportation sectors continued to expand at a healthy pace. Graph 1: Oil demand growth by region, mb/d Oil demand growth in Other Asia primarily India increased by mb/d, this is despite slower-than-expected oil demand growth from India in 1Q17, post demonetisation. Meanwhile, Latin America and Middle East oil demand growth flipped into positive territory in 2017, with the two regions adding a combined mb/d, on the back of an uptick in economic conditions in Brazil, along with firm growth in some countries in Middle East (Graph 1).